Schlüsselbegriffe: Koexistenz von Arten, Interaktionen zwischen Bäumen, Lebensstadien, Waldökosysteme
Available at https://doi.org/10.53203/fs.2301.2
See below the issue 1/2023 as E-Paper or have a look at our E-Paper archive dating back to 1955.
This work is licensed under a Creative Commons Attribution-ShareAlike 4.0 International License.
Abstract
Tree interactions have long been recognised as key biotic interactions in forest ecosystems and their spatial patterns can improve our understanding of forest structure and dynamics. In this study, we explored the intraspecific and interspecific interactions of Betula platyphylla Suk. (birch) and Larix principis-rupprechtii Mayr. (larch) in mountainous forests of northern Hebei, China. The mark correlation function based on tree height was employed in this analysis. Our results showed that the intraspecific interactions in pure birch and larch stands were mainly competition, while in the mixed birch–larch stand, they were mainly facilitation. The intraspecific interaction between saplings and adults changed from competition in the pure birch stand to facilitation in the mixed stand (4.5 < r < 6 m) and an opposite variation was observed for the interaction between birch juveniles and adults (2 < r < 3.5 m). The interspecific interaction between birch and larch mainly appeared as competition, while facilitation between birch saplings/adults and larch juveniles was significant. In contrast to previous studies, our results revealed that the coexistence of birch and larch in mixed forests significantly regulated tree interactions, including competition and facilitation. The findings of this study will help understand the dynamics of similar forest ecosystems and may provide new perspectives for forest management.
Zusammenfassung
Die Interaktionen zwischen Bäumen sind seit langem als wichtige biotische Interaktionen in Waldökosystemen bekannt und ihre räumlichen Muster können unser Verständnis der Waldstruktur und Walddynamik verbessern. In dieser Studie untersuchten wir die intraspezifischen und interspezifischen Interaktionen von Betula platyphylla Suk. (Birke) und Larix principis-rupprechtii Mayr. (Lärche) in Bergwäldern im Norden von Hebei, China. Es wurde die auf Baumhöhe basierende Markkorrelationsfunktion verwendet. Unsere Ergebnisse zeigten, dass die intraspezifischen Interaktionen in reinen Birken- und Lärchen-Beständen hauptsächlich auf Konkurrenz basieren, während in gemischten Birken-Lärchen-Beständen hauptsächlich eine Förderung beobachtet wurde. Darüber hinaus veränderte sich die intraspezifische Interaktion zwischen Jungpflanzen und ausgewachsenen Bäumen von Konkurrenz im reinen Birkenbestand zur Förderung im gemischten Bestand (4,5 < r < 6 m) und eine entgegengesetzte Variation wurde für die Interaktion zwischen jungen und ausgewachsenen Birken beobachtet (2 < r < 3,5 m). Die interspezifische Interaktion zwischen Birke und Lärche trat hauptsächlich als Konkurrenz auf, während die Förderung zwischen jungen/erwachsenen Birken und jungen Lärchen signifikant war. Im Vergleich zu früheren Studien haben unsere Ergebnisse gezeigt, dass die Koexistenz von Birke und Lärche in Mischwäldern durch die Interaktionen zwischen den Bäumen, wie Konkurrenz und Förderung, reguliert wird. Die Ergebnisse dieser Studie können zu einem besseren Verständnis der Entwicklung von Waldökosystemen und deren Dynamik beitragen und neue Perspektiven für die Waldbewirtschaftung eröffnen.
1 Introduction
Plant interactions are key drivers of forest structure and function. Trees are core components of forests, since they link belowground and aboveground communities and regulate stand structures (Jakobsson et al. 2019). Tree interactions are essential ecological forces that shape forest dynamics in time and space, and govern growth, mortality and regeneration processes in plant communities (Seifan & Seifan 2015; Pommerening & Sánchez Meador 2018). The combined effects of tree interactions and environmental conditions determine the spatial distributions of species in forests (Zhang et al. 2010; Sigdel et al. 2020), and also provide insight into the mechanisms of plant coexistence (Zillio & He 2010; Ehlers et al. 2016). Therefore, a clear understanding of species coexistence and tree interactions has both theoretical and practical implications for forest management (Qi et al. 2016). However, it is still a challenge to recognize the relationship between plant species coexistence patterns and complex tree interactions, such as competition and facilitation (Zhou et al. 2019).
In plant communities, previous studies about plant interaction mostly focused on competition (Michalet & Pugnaire 2016). In fact, competition and facilitation operate simultaneously, and thereby affect the outcome of tree interactions (Choler et al. 2001; Bonanomi et al. 2016). Complex combinations of them often occur between plant species and even among the same individuals (Callaway & Walker 1997). Moreover, both competition among reciprocal species and facilitation among competitors could stabilize plant communities (Losapio et al. 2021). One species or individual may benefit others even when they compete for the same limiting resources with it (Wang & Wu 2017). If the balance between benefits and costs is positive, a facilitative interaction is possible to appear and lead to the coexistence of both species (Valiente-Banuet & Verdú 2008; Soliveres et al. 2015). Meanwhile, large numbers of competing species can coexist in ecosystems because of resource limitation and spatial heterogeneity (Harpole & Tilman 2007; Douda et al. 2021).
Plant interactions are usually measured by performance indicators of single plants or plant communities, without consideration for neighbour plants (Pommerening & Sánchez Meador 2018), and these indicators are hard to measure in forests. Increasing methods have been applied to study tree interactions among individuals based on the distance and size of neighbor trees, such as Hegyi's competition index (Hegyi 1974), mingling index (Gadow & Füldner 1993), uniform angle index (Hui et al. 1998), and dominance index (Gadow et al. 2012). Moreover, by indicating the positions of trees, many distribution patterns have been explored and used to analyse tree interactions (Stoyan & Penttinen 2000; Koukoulas & Blackburn 2005; Carrer et al. 2018; Bianchi et al. 2021). The development of spatial point pattern analysis has largely promoted studies on the spatial distribution in natural forests (Ghalandarayeshi et al. 2017; He et al. 2018) and plantations (Zhang et al. 2019). In the spatial point pattern analysis, the mark correlation function kmm(r) was an effective tool and capable of identifying interactive effects in forests (Yilmaz et al. 2019; Yuan et al. 2020). The function was frequently used to analyze spatial interactions of a mark (Illian et al. 2008), which could be a tree size such as diameter or height (Ledo et al. 2011; Erfanifard & Stereńczak 2017). In such analysis, the employment of mark correlation function, which considered the species of trees and their sizes simultaneously, can reveal the specific performance in tree interactions (Wiegand & Moloney 2004). In addition, studying tree interactions by these nonclassical methods can improve the understanding of stand spatial structure and provide more information to guide forest management (Yilmaz et al. 2019).
Mixed-species forests and plantations sometimes have more forest productivity than pure stands, depending on the influences of different plant interactions (Forrester 2014). In mixed stands, plant competition and facilitation are essential to the performance of stands, and can generate greater effects than pure stands (del Río et al. 2014b). Some studies have found that interspecific interactions can improve tree growth in mixed stands under conditions of reduced competition or existing facilitation (Aussenac et al. 2019), and the effects of neighbourhood may vary with growth conditions, species composition and structure (del Rio & Sterba 2009; del Río et al. 2014a). For instance, an experiment in the multispecies forest showed that variations in the competition intensity among trees along soil fertility depend on the context and species (Coates et al. 2013). In addition, the intensity and direction of plant interactions are regulated by life stages (Keammerer & Hacker 2013; Ledo 2015), and competition may intensify from early to late life stages (Schiffers & Tielborger 2006). Despite over a long period of research, however, the differences in tree interactions between mixed and pure stands, and the roles of life stages in this process, are still obscure.
In this study, we hypothesize that tree interactions among life stages will show different patterns when two species coexist in a mixed forest. The mark correlation function was applied to reveal the specific performance in tree interactions by considering the species of trees and their sizes simultaneously (Wiegand & Moloney 2004; Pommerening & Särkkä 2013; Ballani et al. 2019). Tree height was selected as a mark, since it is obviously related to the ability of trees to compete for above-canopy light (Noyer et al. 2019). Using as a case study the tree interactions and coexistence patterns of Betula platyphylla Suk (birch) and Larix principis-rupprechtii Mayr. (larch) in mountainous forests of northern Hebei, China, we aim to
(1) explore the intra- and interspecific interactions among life stages, and
(2) reveal the differences in tree interactions of birch and larch between pure and mixed stands.
2 Material and methods

Figure 1: Study area and plot locations. PB: pure birch stand, PL: pure larch stand, BL: mixed birch-larch stand.
Abbildung 1: Untersuchungsgebiet und Standorte der Parzellen. PB: Birkenreinbestand, PL: Lärchenreinbestand, BL: Birken-Lärchen-Mischbestand.
2.1 Study area
The research was conducted in the mountainous forests of northern Hebei, China. Due to harsh climate conditions and high soil erosion potential in this region, the ecosystem functioning of mountainous forests became threatened (Wang 2001). Human disturbance, such as deforestation, has caused further extensive forest degradation (Liu et al. 2018).
The study area is located in the southeastern Chongli District (40°47’N – 41°17’N, 114°17’E – 115°34’E), the northwest of Hebei province, China (Figure 1). A long snowfall period is prevalent lasting about 150 days. The annual average temperature is 3.7 °C, and the mean annual precipitation is 483.3 mm (Zhang et al. 2021). Mountainous regions with elevation ranging between 1700 m to 2100 m account for 80% of the Chongli District with a forest cover of 71.53% in 2022 (Beijing Daily, http://www.bjd.com.cn). The forest ecosystems are dominated by deciduous broad-leaved and coniferous species, with Betula platyphylla Suk (birch) and Larix principis-rupprechtii Mayr. (larch) being the main tree species (Song et al. 2018). These two tree species are also widespread in northern China and are considered to provide timber with high quality (Guo et al. 2017; Sun et al. 2017).
2.2 Field measurements and data processing
Three 1 hectar (100 m × 100 m) sample plots were established in the study area (Figure 1): PB (pure birch stand) is a secondary forest, PL (pure larch stand) is a plantation and BL (mixed birch–larch stand) is a mixed forest from early planting of larch trees in birch secondary forests. These selected forests are far away from the influence of human activities and have a healthy appearance with little or no dead trees present (Figure A1). We have fenced the perimeter of the sample plots to prevent the damage by humans and/or large animals. The three plots had in general similar ecological conditions, such as aspect, slope, and soil type, to exclude the interference of environmental factors (Table 1). According to the Chinese forest inventory data (National Forestry and Grassland Science Data Center), all three plots were middle-aged forests, with the pure birch stand being somewhat older (Table 1). During the summer of 2020, DBH (diameter at breast height) was measured by a Vernier caliper (precision: 0.01 cm), tree height (H) was measured by an altimeter (precision: 0.1 m), and position was measured by a GPS locator (CHCNAV i70, precision: 1 cm). All trees in three plots with DBH ≥ 1 cm were tagged. Based on the DBH classes, trees were divided into three life stages: (a) saplings, 1 cm ≤ DBH < 5 cm; (b) juveniles, 5 cm ≤ DBH < 15 cm; and (c) adults, DBH ≥ 15 cm (Liu et al. 2020). Life stages less than 50 individuals were excluded (Zhou et al. 2019). Seedlings represent individuals with DBH < 1 cm or tree height < 1.3 m, which were not put into our analyses.
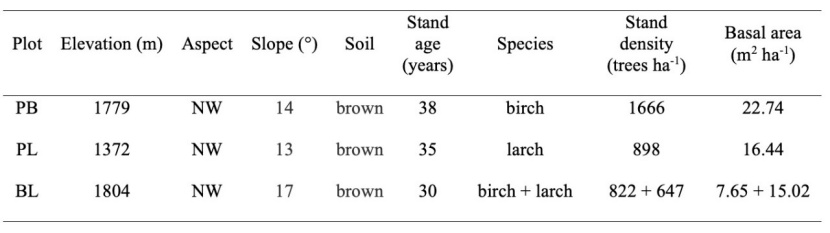
Table 1: Stand properties of the three plots. NW is the northwest.
Tabelle 1: Bestandseigenschaften der drei Probeflächen. NW ist der Nordwesten.
All data were used in ArcGIS 10.2 (Environmental Systems Research Institute, Redlands, State of California, USA), planar coordinates were obtained by a projection transformation tool, and then the latitude and longitude were translated to coordinates x and y within the range of 0–100 m. Then, the distribution of tree positions and heatmaps according to tree height were created using Origin 2021 software (OriginLab, Northampton, Massachusetts, USA). Skewness and kurtosis were calculated in SPSS 24 (International Business Machines Corporation, Armonk, New York, USA) to describe the asymmetry and peak of size (DBH and tree height) distribution, and the normality test was applied by a z-test as shown in Equation (1) (Kim 2013).

where ZS and Zk are z scores for skewness and kurtosis, S and K are values of skewness and kurtosis, SES and SEK are standard errors of skewness and kurtosis.
For sample size n ≤ 50, if |ZS| or |Zk| > 1.96, the distribution is nonnormal (α = 0.05); for 50 < n ≤ 300, if |ZS| or |Zk| > 3.29, the distribution is nonnormal (α = 0.05); for n > 300, if |S| > 2 or |K| > 7, the distribution is nonnormal.
2.3 Spatial point pattern analysis
In our study, tree height was applied as a mark in the mark correlation function kmm(r), which was seldom used because of its difficulty in measurement. This research used univariate mark correlation functions to analyze intraspecific interactions and bivariate mark correlation functions to analyze both intra- and interspecific interactions between life stages. All functions were computed in Programita software (Weigand & Moloney 2014). The null model of our study was random labeling, and the moving window of the radius in the software was set to 30 m (Wiegand & Moloney 2004). To test the significance level of statistical analysis, 99% confidence envelopes were obtained based on the fifth highest and lowest of 999 Monte Carlo simulations, using a GoF (goodness-of-fit) test with α = 0.01 (Ghalandarayeshi et al. 2017). After exporting the data, line graphs were plotted in Origin 2021. If the observed kmm(r) was above the envelope, the tree heights of two trees were positively correlated; if the observed kmm(r) was inside the envelope, the tree heights were independent; otherwise, the tree heights were negatively correlated. A positive correlation indicated that two trees were facilitative, while a negative correlation indicated that two trees were competitive (Weigand & Moloney 2014).
2.4 Interaction intensity index
In plant communities, the strength of interaction was usually measured as the ratio of some performance variables, and the interaction index should be relative (Armas et al. 2004). The deviation of the kmm(r) curve from the envelope frequently indicated competition or facilitation (Weigand & Moloney 2014). To show the strength of competition and facilitation, the ratio of the area of the kmm(r) curve deviating from the confidence envelope line to the area of the confidence envelope was used to represent the interaction intensity (I). If I > 0, the interaction was mainly facilitative; if I = 0, the interaction was mainly independent; and if I < 0, the interaction was mainly competitive. In total, three scenarios were presented as follows:
(1) Scenario I: The kmm(r) curve is above the envelope.

where ri and rj denote horizontal coordinates of intersections between the kmm(r) curve and the upper envelope line, U(r) denotes the upper envelope line, and R denotes the moving window of radius.
(2) Scenario II: The kmm(r) curve is completely inside the envelope. I = 0, and the interaction is independent.
(3) Scenario III: The kmm(r) curve is below the envelope.

where ri and rj denote horizontal coordinates of intersections between the kmm(r) curve and the upper envelope line, L(r) denotes the lower envelope line, and R denotes the moving window of radius.
3.1 Stand structure
In three 1-ha plots, a total of 4033 trees were measured, and more birch trees were observed than larch. Birch had a higher basal area than larch in pure stands, while the opposite result was observed in mixed stands (Table 1). Across three plots, we observed more juveniles, then adults, and a few saplings (Table 2). Heatmaps showed the spatial distribution of tree height created from field data. In general, tree height was displayed in a patchy distribution across all plots (Figure 2), and values at coordinate x of 0–50 m were significantly higher than at 50–100 m in PB (F = 37.858, p < 0.001). The tree height in three plots increased with DBH size class (Figure A2, p < 0.001), and larch trees were taller than birch trees in general (Table A1).

Figure 2: Spatial distribution of species regarding tree height heterogeneity (left), DBH (middle), and tree height (H, right). (a): birch in PB; (b): larch in PL; (c): birch in BL (BL-B); (d): larch in BL (BL-L). Gray color represents null values; □ : saplings; ○ : juveniles; ∆ : adults.
Abbildung 2: Räumliche Verteilung der Arten in Bezug auf die Heterogenität der Baumhöhe (links), die DBH (Mitte) und die Baumhöhe (H, rechts). (a): Birke in PB; (b): Lärche in PL; (c): Birke in BL (BL-B); (d): Lärche in BL (BL-L). Graue Farbe steht für Nullwerte; □ : Jungbäume; ○ : heranwachsende Bäume; ∆ : ausgewachsene Bäume.

Table 2: The number of individuals per hectare for each of the four stages across the three plots.
Tabelle 2: Die Anzahl der Individuen pro Hektar für jedes der vier Entwicklungsstadien in den drei Probeflächen.
As shown in Figure 2, the distributions of DBH and tree height were all normal (|S| < 2 and |K| < 7). In PB, the DBH size structure of birch showed significantly positive skewness (p < 0.05), and there were more juveniles than saplings and adults (Figure 2a). The range of DBH size was wide, up to 45 cm, while the tree height structure (R2 = 0.9476, skewness = -0.308, kurtosis = 0.176) tended to be more normally distributed than the DBH (R2 = 0.9003, skewness = 0.887, kurtosis = 0.710). Within the DBH size class, the tree height structure conformed to the total structure, except that the tree height of individuals with DBH at 15-30 cm showed a non-normal distribution (Table A1). In PL, the DBH structure was also well described by normal distribution (R2 = 0.9993), and most larch trees were approximately 15 m tall (Figure 2b). The tree height structure was similar to the DBH structure, while the skewness was negative. Moreover, normal distributions were observed within all DBH classes (Table A1).
For birch trees in BL, the skewness of DBH structure was similar to that in PB, and the distribution was normal (Figure 2c). In contrast, the tree height structure varied in BL, showing a J shape and poor normality (R2 = 0.7694). Within the DBH size class, the tree height distribution of birch saplings was non-normal (|ZS| > 3.29). For larch trees in BL, a non-normal distribution was also observed (Table A1). However, the DBH distribution of larch trees was different from that of birch. The negative skewness of the DBH structure indicated a predominance of large larch trees (Figure 2d).
3.2 Intraspecific competition and facilitation between trees
In all the three plots, both birch and larch trees showed a significant aggregated distribution (Figure A3). For birch trees in PB, a significant spatial correlation (p < 0.01) was found among the tree height of individuals at all scales (Figure 3a), which can also be observed between saplings and adults (Figure 3c). Conversely, birch saplings and juveniles showed positive correlations at most scales, so did juveniles and adults at all scales (Figure 3b, c).

Figure 3: Mark correlation functions kmm(r) for the intraspecific association of tree height between birch trees in PB. Black lines indicate the observed kmm(r), and blue lines indicate the 99% Monte Carlo envelopes.
Abbildung 3: Markkorrelationsfunktionen kmm(r) für die intraspezifische Assoziation der Baumhöhe zwischen Birken in PB. Schwarze Linien zeigen die beobachteten kmm(r) an, blaue Linien die 99 % Monte-Carlo-Hüllkurven.
In PL, no significant interactions (p > 0.01) were found for larch trees (Figure 4). The kmm(r) curves were within the simulation envelopes at most scales, indicating that the tree height of two nearby larch trees tends to be independent, although negative interactions appeared at 15–16 m for all trees (Figure 4a). The interaction intensities (I) in the three plots were calculated using the integral area for the three scenarios, and the results indicated that the strongest competitive (all birch trees) and facilitative (juveniles vs adults) effects occurred in PB. However, the weakest competition (all larch trees in PL) and facilitation (larch juveniles in BL) were observed among larch trees.

Figure 4: Mark correlation functions kmm(r) for the intraspecific association of tree height between larch trees in PL. Black lines indicate the observed kmm(r), and blue lines indicate the 99% Monte Carlo envelopes.
Abbildung 4: Markierungskorrelationsfunktionen kmm(r) für die intraspezifische Assoziation der Baumhöhe zwischen Lärchenbäumen in PL. Schwarze Linien zeigen die beobachteten kmm(r) an, blaue Linien die 99 % Monte-Carlo-Hüllkurven.
For birch trees in BL, a significant positive correlation was found among the tree height of all trees (Figure 5a). Similarly, saplings were attractive to juveniles at all scales (Figure 5b). However, independent associations were observed at most scales between saplings and adults, as well as juveniles and adults (Figure 5c, d). There was a weak competitive effect among saplings (I = -0.0044), while both juveniles and adults have a significant positive spatial correlation with the tree height of saplings (Figure 5b, c). For larch trees in BL, the kmm(r) curves exhibited no significant interactions (p > 0.01) among individuals (Figure 6). Conversely, facilitation was found among all trees at 2–5 m, 6–7 m, and 13–16 m (Figure 6a), while juveniles and adults were independent at all scales (Figure 6b). In terms of interactions within the same life stage, strong facilitation was observed among birch juveniles, while weak facilitation was observed for larch juveniles and adults. Moreover, the strength of facilitation among birch trees was stronger than that among larch trees. Generally, the above intraspecific interactions were largely driven by birch juveniles and larch adults (Figure A4).

Figure 5: Mark correlation functions kmm(r) for the intraspecific association of tree height between birch trees in BL. Black lines indicate the observed kmm(r), and blue lines indicate the 99% Monte Carlo envelopes.
Abbildung 5: Markkorrelationsfunktionen kmm(r) für die intraspezifische Assoziation der Baumhöhe zwischen Birken in BL. Schwarze Linien zeigen die beobachteten kmm(r), und blaue Linien zeigen die 99 % Monte-Carlo-Hüllkurven.

Figure 6: Mark correlation functions kmm(r) for the intraspecific association of tree height between larch trees in BL. Black lines indicate the observed kmm(r), and blue lines indicate the 99% Monte Carlo envelopes.
Abbildung 6: Markierungskorrelationsfunktionen kmm(r) für die intraspezifische Assoziation der Baumhöhe zwischen Lärchenbäumen in BL. Schwarze Linien zeigen die beobachteten kmm(r) an, blaue Linien die 99 % Monte Carlo-Hüllkurven.
When comparing pure and mixed stands, the competition among birch trees in PB was largely stronger than the facilitation in BL (Table 3). Meanwhile, interactions within birch saplings and birch juveniles in PB were opposite to birch trees in BL (Figure A4), and similar conditions occurred between different life stages. Conversely, the competition among larch trees in PL was smaller than the facilitation in BL, and stronger interactions among different life stages were observed for larch trees in BL than in PL (Figure A4).

Table 3: The strength of intraspecific interactions. *: p < 0.05; **: p < 0.01.
Tabelle 3: Die Stärke der intraspezifischen Interaktionen. *: p < 0.05; **: p < 0.01.
3.3 Interspecific competition and facilitation between trees
The interspecific interactions between birch and larch trees are shown in Figure 7. It can be seen that a significant negative (p = 0.0010) correlation arised between the tree height of juveniles at 0–3 m (Figure 7c), indicating that birch and larch juveniles mutually hindered the growth of tree height. The competitive effect between larch juveniles and birch juveniles (|I| = 0.0418) was stronger than the facilitative effect within larch juveniles (|I| = 0.0001), but birch juveniles and larch adults had stronger competition than facilitation within larch adults. However, birch and larch adults were independent at all scales (Figure 7f), and there was no significant departure (p > 0.01) from envelopes, revealing that adults of the two dominant species had no spatial interaction in terms of tree height.

Figure 7: Bivariate mark correlation functions kmm(r) for the interspecific association of tree height in BL. Black lines indicate the observed kmm(r), and blue lines indicate the 99% Monte Carlo envelopes.
Abbildung 7: Bivariate Markenkorrelationsfunktionen kmm(r) für die interspezifische Assoziation der Baumhöhe in BL. Schwarze Linien zeigen die beobachteten kmm(r) , und blaue Linien zeigen die 99 % Monte Carlo Hüllkurven.
Turning now to species pairs between different life stages, both positive and negative associations were observed. Birch saplings and adults were attractive to larch juveniles at some scales, while the facilitation between birch saplings and larch juveniles was stronger than that between birch adults and larch juveniles (Figure 7a, e), which was also stronger than the competition between birch juveniles and larch juveniles. This result revealed that birch saplings and larch juveniles could maintain optimal co-growth patterns. Conversely, negative associations were found when comparing birch saplings and juveniles with larch adults, and the intensity between birch saplings and larch adults was weaker than that between birch juveniles and larch adults (Figure 7b, d).

Table 4: The strength of interspecific interactions. *: p < 0.05; **: p < 0.01.
Tabelle 4: Die Stärke der interspezifischen Interaktionen. *: p < 0.05; **: p < 0.01.
Overall, the interspecific competition in the mixed stand was weaker than the intraspecific competition in the pure birch stand but stronger than that in the pure larch stand (Table 4). Among the different life stages, the interspecific facilitation between saplings and juveniles in the mixed stand was stronger than the intraspecific facilitation in the pure birch stand. However, for saplings and adults, more interspecific competition effects were observed in the mixed stand than the intraspecific interactions in the pure birch stand (Figure A4). Moreover, the facilitation between juveniles and adults in the pure birch stand was stronger than interspecific interactions between those life stages in the mixed stand. Whether competition or facilitation, tree interactions between different life stages in the mixed stand were frequently stronger than those in the pure larch stand.
4 Discussion
4.1 Stand structure
In the study area, birch was the main native tree species, while fast-growing larch was mostly artificially planted (Song et al. 2018). For a clear knowledge of tree interactions, our study started by analyzing the spatial structures. As major stand attributes, stand structure and community composition interdependently affect forest ecosystem function (Carvalho 2011). Studies on the stand structure of boreal forests in China have been reported (Fang et al. 2012; Gao et al. 2013). However, our results also compared the differences between pure and mixed forests. Meanwhile, as three main forest types in northern Hebei, pure birch secondary forests, pure larch plantations, and birch-larch mixed forests were rarely studied. Our results found that both DBH size structure and tree height structure showed a normal distribution (Figure 2). It has been demonstrated that the normal distribution was closest to the actual DBH structures for stands in the growing up or break-up stage (Podlaski 2006). It should be noted that the distribution skewness in the mixed stand was frequently larger than that in pure stands. Interestingly, more seedlings were found in the mixed stand, and more saplings were observed for birch than that for larch (Table 2). A reasonable explanation was that the formation of mixed forests can also change the original stand structure; for example, plantations facilitated forest succession and produced a conducive environment for the regeneration of native trees (Shoyama 2013). Moreover, both DBH size and tree height structures were always characterized by positive kurtosis (Figure 2). In contrast, Orzel et al. (2017) found that the DBH distribution of majority stands had right-sided asymmetry and negative kurtosis. However, these variations in stand structure could result from differences in species community and even alter the spatial distribution.
Heatmap was applied to reveal the spatial distribution of tree height, and values of tree height presented patchy distributions across the three stands (Figure 2). Trees tended to form complex patches with different sizes, species, and ages (Dale 1999). Patchy distributions existed in most ecosystems, and the locations of high- and low-density patches frequently vary with time (Effenberger et al. 2011). Similarly, Yuan et al. (2020) provided the spatial variability maps of biomass, with a patchy distribution of C for all species. Goode et al. (2021) found that shortleaf pine was clustered into distinct patches at the stand scale. In line with our findings, polarization of the tree height distribution was observed in two pure stands. The vegetation structure in fragmented landscapes is mostly determined by the location and size of patches, as well as disturbances (Schippers et al. 2014). According to the survey, there was overgrazing in local forests a few years ago. Meanwhile, environmental pollution and human disturbance have affected the forest structure. Hence, the results reported in this study could be influenced by the above factors and caused the polarization of patches in pure stands.
The underlying ecological processes, e.g., competition and facilitation, can be deduced by analyzing spatial distribution (Pillay & Ward 2012; Hesselbarth et al. 2018). However, regardless of the stand structure or heatmaps, they simply characterized the overall pattern. One important extension for spatial distribution is the consideration of spatial scales (Weigand & Moloney 2014).
4.2 Adjustment of tree competition and facilitation in pure and mixed stands
Competition for light is a central process that offers opportunities for niche differentiation and contributes to the coexistence of tree species (Grote et al. 2013). In forests, the light environment brightens with increasing tree height (Osada et al. 2004), and tree height is related to their ability to compete for above-canopy light (Elmendorf & Moore 2007; Noyer et al. 2019). The spatial association of tree height may imply light competition within forest ecosystems. Therefore, the competition and facilitation in this study were mainly associated with the utilization of light resources. Most importantly, we utilized spatial point pattern analysis to elucidate whether species coexistence of birch and larch regulated tree interactions. Here, we found that competition and facilitation operate simultaneously, which can be confirmed by similar findings from other boreal forests (Omelko et al. 2018; Liu et al. 2020).
Previous studies have shown that aggregation was a widespread pattern in nature (Li et al. 2009). In our study, the spatial distributions of tree positions were aggregated across all plots (Figure A3). One of the major mechanisms contributing to aggregation was reported as neighborhood competition (Canham et al. 2006; Getzin et al. 2008; Liu et al. 2021). Conversely, facilitation between conspecific individuals was also considered a key driver of small-scale aggregation (Montesinos et al. 2007; Gimeno et al. 2015). Simultaneously, observed competition and facilitation were consistent with these theories (Table 3), which allowed us to reasonably speculate that aggregation was a suitable distribution pattern in local forests. Tree competition and facilitation contribute to the formation of spatial patterns, as well as species coexistence (Barabás et al. 2016; Abd-ElGawad et al. 2020; Brewer et al. 2021; Eigentler 2021).
In principle, species coexistence could also determine tree interactions (Ormeño et al. 2007). Therefore, we investigated whether there were differences in interactions between pure and mixed stands. Notably, on one hand, the mixed forest in our study has existed locally for decades, and the two species could coexist stably. On the other hand, the mixed forest was the result of a natural conversion of pure forests. Our findings showed that tree interactions were dominated by intraspecific competition in pure birch and larch stands and by intraspecific facilitation in mixed birch-larch stands (Table 3). This result confirmed that interspecific competition was stronger than intraspecific competition. We conjectured that trees select intraspecific facilitation to resist interspecific competition. In mixed forests, with increasing environmental stress caused by interspecies or water levels, the strength of competition decreased while facilitation increased (Maestre et al. 2009; Luo et al. 2010). Although there were some differences from previous studies (Tilman 1982; Chesson 2000; Xia et al. 2016), our finding was consistent with that of Goldberg & Barton (1992), who reported that intraspecific competition was sometimes weaker than interspecific competition. Recently, Guo et al. (2022) also found that interspecific competition was greater than intraspecific competition between two host plants through AM fungi interacting with litter. Improvement of the stress factor, ecophysiological requirements of different species, and tolerances determined the outcome of interactions (Maestre et al. 2005).
Our results suggested that each species limited the growth of its competitors more than the limits on its own population. For example, the facilitation within birch juveniles was largely stronger than the interspecific competition with larch trees (Figure A4, Table 4). In this way, it was assumed that the mixed forest created better conditions that favor birch juveniles, while the growth of nearby larch trees was limited. Previous studies reported that birch trees got a long juvenile stage, inducing a delay in reproduction (Truong et al. 2007; Sun et al. 2012). Therefore, the number of birch juveniles in mixed forests should be strictly controlled. However, birch adults and all larch trees could facilitate each other, and this coexistence pattern also had implications for the interactions among other life stages. Moreover, birch saplings were subjected to the competitive effects of adults in the pure stand while facilitated by both juveniles and adults in the mixed stand (Table 3). A similar result was also reported by Liu et al. (2020), although the studied species were different. The significant competition between birch saplings and larch adults indicated that birch saplings struggle to survive under the canopy of larch adults (Table 4). Birch saplings have a strong growth response to the canopy openings that are important for sapling growth (Takahashi & Rustandi 2006). This result may be explained by the fact that birch trees have larger canopy openings than larch trees. In summary, differences in tree interactions between pure and mixed forests reveal the regulation of species coexistence on tree competition and facilitation.
4.3 Implications and management suggestions
Species coexistence and tree interactions have drawn considerable attention in plant ecology due to their key role in preserving biodiversity. An implication of our findings is that the coexistence of birch and larch regulated intra- and interspecific interactions within and between different life stages. A better understanding of the tree interactions among species will improve our exploration of ecosystem conservation. The findings will be useful in identifying the shifting of ecological processes and providing insight for studies on the regulatory mechanism of multispecies coexistence. Despite promising results, further work is still required to investigate the influence of environmental factors (e.g., degradation, climate variables, and soil nutrients) and other plants such as shrubs and grasses. Our results supply an instructive and theoretical basis for the management of local forests and facilitate the determination of reasonable thinning and planting strategies. For example,
(1) in pure birch secondary forests, adults need to be removed regularly at some distance to maintain the growth of saplings;
(2) in pure larch plantations, distances between trees should be noted to prevent fragile stand structures caused by excessive independence, and planting birch saplings in the gap is a good operation to make full use of stand space; and
(3) in mixed birch-larch forests, birch juveniles and larch adults need to be thinned at some distance to ensure stable coexistence and regeneration. Furthermore, manual thinning should also be manipulated to ensure the proper distance between trees.
5 Conclusions
There has been a great focus on understanding the effects of tree interactions on species coexistence. However, the adjustment of tree competition and facilitation when two species coexist has not been documented previously in forest ecosystems. By using spatial point pattern analysis in mountainous forests of northern Hebei, this study demonstrated that tree interactions were dominated by intraspecific competition in pure stands while by intraspecific facilitation to resist interspecific competition in the mixed stand. The findings of our study revealed the spatial patterns of local typical forests and offer detailed information about the ecological process of how species coexistence regulates tree interactions. Specifically, spatial patterns and species coexistence mechanisms will have implications for species diversity and forest regeneration. Our understanding of the underlying dynamics and selection strategies of tree competition and facilitation in such pure and mixed forests can be used in practical forest management. Furthermore, the current data implied that the conversion from pure plantations to mixed birch–larch forests would be the optimal strategy in local forest ecosystems.
Despite the regional limitations, the present study employed an efficient method to evaluate the regulation of species coexistence on tree interactions and provided support for further studies on multispecies coexistence. Future research should consider the potential effects of environmental factors such as climate variables and soil nutrients.
Data Availability Statement
The data that support the findings of this study are available from the corresponding author, [Huayong Zhang], upon reasonable request.
Acknowledgements
We thank Dr. Edmond Sanganyado from Northumbria University for polishing the language. Thanks are due to Yu Zheng, Xinxin Zhen, and Zhuoqing Bai for assistance with experiments and data processing.
Funding
This work was supported by the “National Water Pollution Control and Treatment Science and Technology Major Project”, grant number “2017ZX07101-002”.
Declaration of interest statement
The authors declare no competing interests.
References
Abd-ElGawad AM, Rashad YM, Abdel-Azeem AM, Al-Barati SA, Assaeed AM, Mowafy AM. 2020. Calligonum polygonoides L. shrubs provide species-specific facilitation for the understory plants in coastal ecosystem. Biology. 9(8):232.
Armas C, Ordiales R, Pugnaire FI. 2004. Measuring plant interactions: A new comparative index. Ecology. 85(10):2682-2686.
Aussenac R, Bergeron Y, Gravel D, Drobyshev I. 2019. Interactions among trees: A key element in the stabilising effect of species diversity on forest growth. Functional Ecology. 33(2):360-367.
Ballani F, Pommerening A, Stoyan D. 2019. Mark-mark scatterplots improve pattern analysis in spatial plant ecology. Ecological Informatics. 49:13-21.
Barabás G, Michalska-Smith MJ, Allesina S. 2016. The effect of intra- and interspecific competition on coexistence in multispecies communities. The American Naturalist. 188(1):1-12.
Bianchi E, Bugmann H, Hobi ML, Bigler C. 2021. Spatial patterns of living and dead small trees in subalpine Norway spruce forest reserves in Switzerland. Forest Ecology and Management. 494:119315.
Bonanomi G, Stinca A, Chirico GB, Ciaschetti G, Saracino A, Incerti G. 2016. Cushion plant morphology controls biogenic capability and facilitation effects of Silene acaulis along an elevation gradient. Functional Ecology. 30(7):1216-1226.
Brewer JS, Paniw M, Ojeda F. 2021. Plant behavior and coexistence: Stem elongation of the carnivorous subshrub Drosophyllum lusitanicum within xerophytic shrub canopies. Plant Ecology. 222(11):1197-1208.
Callaway RM, Walker LR. 1997. Competition and facilitation: A synthetic approach to interactions in plant communities. Ecology. 78(7):1958-1965.
Canham CD, Papaik MJ, Uriarte M, McWilliams WH, Jenkins JC, Twery MJ. 2006. Neighborhood analyses of canopy tree competition along environmental gradients in New England forests. Ecological Applications. 16(2):540-554.
Carrer M, Castagneri D, Popa I, Pividori M, Lingua E. 2018. Tree spatial patterns and stand attributes in temperate forests: The importance of plot size, sampling design, and null model. Forest Ecology and Management. 407:125-134.
Carvalho JPF. 2011. Composition and structure of natural mixed-oak stands in northern and central Portugal. Forest Ecology and Management. 262(10):1928-1937.
Chesson P. 2000. Mechanisms of maintenance of species diversity. Annual Review of Ecology and Systematics. 31(1):343-366.
Choler P, Michalet R, Callaway RM. 2001. Facilitation and competition on gradients in alpine plant communities. Ecology. 82(12):3295-3308.
Coates KD, Lilles EB, Astrup R. 2013. Competitive interactions across a soil fertility gradient in a multispecies forest. Journal of Ecology. 101(3):806-818.
Dale MRT. 1999. Spatial pattern analysis in plant ecology, Cambridge University Press.
del Río M, Condés S, Pretzsch H. 2014a. Analyzing size-symmetric vs. size-asymmetric and intra- vs. inter-specific competition in beech (Fagus sylvatica L.) mixed stands. Forest Ecology and Management. 325:90-98.
del Río M, Schütze G, Pretzsch H. 2014b. Temporal variation of competition and facilitation in mixed species forests in Central Europe. Plant Biology. 16(1):166-176.
del Rio M, Sterba H. 2009. Comparing volume growth in pure and mixed stands of Pinus sylvestris and Quercus pyrenaica. Annals of Forest Science. 66(5):502.
Douda J, Doudová J, Holeštová A, Boublík K, Havrdová A, Slezák M. 2021. Interplay of above- and belowground resource limitations: a competition–facilitation shift maintains species coexistence. Oikos. 130(12):2122-2135.
Effenberger M, Diehl S, Gerth M, Matthaei CD. 2011. Patchy bed disturbance and fish predation independently influence the distribution of stream invertebrates and algae. Journal of Animal Ecology. 80(3):603-614.
Ehlers BK, Damgaard CF, Laroche F. 2016. Intraspecific genetic variation and species coexistence in plant communities. Biology Letters. 12(1):20150853.
Eigentler L. 2021. Species coexistence in resource-limited patterned ecosystems is facilitated by the interplay of spatial self-organisation and intraspecific competition. Oikos. 130(4):609-623.
Elmendorf SC, Moore KA. 2007. Plant competition varies with community composition in an edaphically complex landscape. Ecology. 88(10):2640-2650.
Erfanifard Y, Stereńczak K. 2017. Intra- and interspecific interactions of Scots pine and European beech in mixed secondary forests. Acta Oecologica. 78:15-25.
Fang JY, Wang XP, Liu YN, Tang ZY, White PS, Sanders NJ. 2012. Multi-scale patterns of forest structure and species composition in relation to climate in northeast China. Ecography. 35(12):1072-1082.
Forrester DI. 2014. The spatial and temporal dynamics of species interactions in mixed-species forests: From pattern to process. Forest Ecology and Management. 312:282-292.
Gadow Kv, Füldner K. 1993. Zur Bestandesbeschreibung in der Forsteinrichtung. Forst und Holz. 48(21):602-606.
Gadow Kv, Zhang CY, Wehenkel C, Pommerening A, Corral-Rivas J, Korol M, Myklush S, Hui GY, Kiviste A, Zhao XH. 2012. Forest structure and diversity. In: Pukkala, T., von Gadow, K. (Eds.), Continuous cover forestry. Springer Netherlands, Dordrecht, pp. 29-83.
Gao G, Ding G, Wang H, Zang Y, Liang W, An Y, He Y. 2013. Short communication. Restoring monoculture plantation using stand spatial structure analysis. Forest Systems. 22(1):147-151.
Getzin S, Wiegand T, Wiegand K, He F. 2008. Heterogeneity influences spatial patterns and demographics in forest stands. Journal of Ecology. 96(4):807-820.
Ghalandarayeshi S, Nord-Larsen T, Johannsen VK, Larsen JB. 2017. Spatial patterns of tree species in Suserup Skov – a semi-natural forest in Denmark. Forest Ecology and Management. 406:391-401.
Gimeno TE, Escudero A, Valladares F. 2015. Different intra- and interspecific facilitation mechanisms between two Mediterranean trees under a climate change scenario. Oecologia. 177(1):159-169.
Goldberg DE, Barton AM. 1992. Patterns and consequences of interspecific competition in natural communities: A review of field experiments with plants. The American Naturalist. 139(4):771-801.
Goode JD, Hart JL, Dey DC, Torreano SJ, Clark SL. 2021. Spatial patterns of canopy disturbance and shortleaf pine in a mixedwood forest. Forest Science. 67(4):433-445.
Grote S, Condit R, Hubbell S, Wirth C, Ruger N. 2013. Response of demographic rates of tropical trees to light availability: Can position-based competition indices replace information from canopy census data? Plos One. 8(12):e81787.
Guo SL, Zhang DH, Wei HY, Zhao YN, Cao YB, Yu T, Wang Y, Yan XF. 2017. Climatic factors shape the spatial distribution of concentrations of triterpenoids in barks of white birch (Betula Platyphylla Suk.) trees in northeast China. Forests. 8(9):334.
Guo Y, He YJ, Wu P, Wu BL, Lin Y, He MH, Han X, Xia TT, Shen KP, Kang LL, Tan QY, Ren WD, Sun Y, Li Q. 2022. The interspecific competition presents greater nutrient facilitation compared with intraspecific competition through AM fungi interacting with litter for two host plants in karst soil. Journal of Plant Ecology. 15(2):399-412.
Harpole WS, Tilman D. 2007. Grassland species loss resulting from reduced niche dimension. Nature. 446(7137):791-793.
He Z, Fang S, Chen L, Du J, Zhu X, Lin P. 2018. Spatial patterns in natural Picea crassifolia forests of northwestern China, as basis for close-to-nature forestry. Journal of Mountain Science. 15(9):1909-1919.
Hegyi F. 1974. A simulation model for managing jack-pine stands. In, Growth models for tree and stand simulation, Royal College of Forestry,Stockholm, pp. 74-90.
Hesselbarth MHK, Wiegand K, Dreber N, Kellner K, Esser D, Tsvuura Z. 2018. Density-dependent spatial patterning of woody plants differs between a semi-arid and a mesic savanna in South Africa. Journal of Arid Environments. 157:103-112.
Hui GY, Albert M, Gadow Kv. 1998. DasUmgebungsmaß als Parameter zur Nachbildung von Bestandesstrukturen. Forstwissenschaftliches Centralblatt vereinigt mit Tharandter forstliches Jahrbuch. 117(1):258-266.
Illian J, Penttinen A, Stoyan H, Stoyan D. 2008. Statistical analysis and modelling of spatial point patterns. John Wiley & Sons, England.
Jakobsson S, Plue J, Cousins SAO, Lindborg R. 2019. Exploring the effects of pasture trees on plant community patterns. Journal of Vegetation Science. 30(5):809-820.
Keammerer HB, Hacker SD. 2013. Negative and neutral marsh plant interactions dominate in early life stages and across physical gradients in an Oregon estuary. Plant Ecology. 214(2):303-315.
Kim HY. 2013. Statistical notes for clinical researchers: assessing normal distribution (2) using skewness and kurtosis. Restorative Dentistry & Endodontics. 38(1):52-54.
Koukoulas S, Blackburn GA. 2005. Spatial relationships between tree species and gap characteristics in broad-leaved deciduous woodland. Journal of Vegetation Science. 16(5):587-596.
Ledo A. 2015. Nature and age of neighbours matter: Interspecific associations among tree species exist and vary across life stages in tropical forests. Plos One. 10(11):e0141387.
Ledo A, Condes S, Montes F. 2011. Intertype mark correlation function: A new tool for the analysis of species interactions. Ecological Modelling. 222(3):580-587.
Li L, Huang Z, Ye W, Cao H, Wei S, Wang Z, Lian J, Sun I-F, Ma K, He F. 2009. Spatial distributions of tree species in a subtropical forest of China. Oikos. 118(4):495-502.
Liu CP, Xu ZH, Lu GJ, Li XJ, Zheng CH, Ren QW. 2018. Introduction and strategy of stress-resistance introduction for forest in northwest Hebei. Forest Science and Technology. 7:19-23.
Liu J, Bai XJ, Yin Y, Wang WG, Li ZQ, Ma PY. 2021. Spatial patterns and associations of tree species at different developmental stages in a montane secondary temperate forest of northeastern China. Peerj. 9:e11517.
Liu PC, Wang WD, Bai ZQ, Guo ZJ, Ren W, Huang JH, Xu Y, Yao J, Ding Y, Zang RG. 2020. Competition and facilitation co-regulate the spatial patterns of boreal tree species in Kanas of Xinjiang, northwest China. Forest Ecology and Management. 467:118167.
Losapio G, Schöb C, Staniczenko PPA, Carrara F, Palamara GM, De Moraes CM, Mescher MC, Brooker RW, Butterfield BJ, Callaway RM, Cavieres LA, Kikvidze Z, Lortie CJ, Michalet R, Pugnaire FI, Bascompte J. 2021. Network motifs involving both competition and facilitation predict biodiversity in alpine plant communities. PNAS. 118(6):e2005759118.
Luo WB, Xie YH, Chen XS, Li F, Qin XY. 2010. Competition and facilitation in three marsh plants in response to a water-level gradient. Wetlands. 30(3):525-530.
Maestre FT, Callaway RM, Valladares F, Lortie CJ. 2009. Refining the stress-gradient hypothesis for competition and facilitation in plant communities. Journal of Ecology. 97(2):199-205.
Maestre FT, Valladares F, Reynolds JF. 2005. Is the change of plant–plant interactions with abiotic stress predictable? A meta-analysis of field results in arid environments. Journal of Ecology. 93(4):748-757.
Michalet R, Pugnaire FI. 2016. Facilitation in communities: underlying mechanisms, community and ecosystem implications. Functional Ecology. 30(1):3-9.
Montesinos D, Verdú M, García-Fayos P. 2007. Moms are better nurses than dads: Gender biased self-facilitation in a dioecious Juniperus tree. Journal of Vegetation Science. 18(2):271-280.
Noyer E, Ningre F, Dlouha J, Fournier M, Collet C. 2019. Time shifts in height and diameter growth allocation in understory European beech (Fagus sylvatica L.) following canopy release. Trees-Structure and Function. 33(2):333-344.
Omelko A, Ukhvatkina O, Zhmerenetsky A, Sibirina L, Petrenko T, Bobrovsky M. 2018. From young to adult trees: How spatial patterns of plants with different life strategies change during age development in an old-growth Korean pine-broadleaved forest. Forest Ecology and Management. 411:46-66.
Ormeño E, Fernandez C, Mévy JP. 2007. Plant coexistence alters terpene emission and content of Mediterranean species. Phytochemistry. 68(6):840-852.
Orzel S, Pogoda P, Ochal W. 2017. Evaluation of usefulness of selected functions for modeling distribution of breast height diameter in black alder stands (Alnus glutinosa (L.) Gaertn.). Sylwan. 161(2):101-113.
Osada N, Tateno R, Hyodo F, Takeda H. 2004. Changes in crown architecture with tree height in two deciduous tree species: Developmental constraints or plastic response to the competition for light? Forest Ecology and Management. 188(1):337-347.
Pillay T, Ward D. 2012. Spatial pattern analysis and competition between Acacia karroo trees in humid savannas. Plant Ecology. 213(10):1609-1619.
Podlaski R. 2006. Suitability of the selected statistical distributions for fitting diameter data in distinguished development stages and phases of near-natural mixed forests in the Swietokrzyski National Park (Poland). Forest Ecology and Management. 236(2-3):393-402.
Pommerening A, Sánchez Meador AJ. 2018. Tamm review: Tree interactions between myth and reality. Forest Ecology and Management. 424:164-176.
Pommerening A, Särkkä A. 2013. What mark variograms tell about spatial plant interactions. Ecological Modelling. 251(1):64-72.
Qi L, Yang J, Yu D, Dai L, Contrereas M. 2016. Responses of regeneration and species coexistence to single-tree selective logging for a temperate mixed forest in eastern Eurasia. Annals of Forest Science. 73(2):449-460.
Schiffers K, Tielborger K. 2006. Ontogenetic shifts in interactions among annual plants. Journal of Ecology. 94(2):336-341.
Schippers P, van Teeffelen AJA, Verboom J, Vos CC, Kramer K, WallisDeVries MF. 2014. The impact of large herbivores on woodland-grassland dynamics in fragmented landscapes: The role of spatial configuration and disturbance. Ecological Complexity. 17:20-31.
Seifan T, Seifan M. 2015. Symmetry and range limits in importance indices. Ecology and Evolution. 5(20):4517-4522.
Shoyama K. 2013. Effects of thinning and excluding deer browsing on sapling establishment and growth in larch plantations. Landscape and Ecological Engineering. 9(1):77-87.
Sigdel SR, Liang E, Wang Y, Dawadi B, Camarero JJ. 2020. Tree-to-tree interactions slow down Himalayan treeline shifts as inferred from tree spatial patterns. Journal of Biogeography. 47(8):1816-1826.
Soliveres S, Maestre FT, Berdugo M, Allan E. 2015. A missing link between facilitation and plant species coexistence: nurses benefit generally rare species more than common ones. Journal of Ecology. 103(5):1183-1189.
Song S, Zhang S, Wang T, Meng J, Zhou Y, Zhang H. 2018. Balancing conservation and development in Winter Olympic construction: Evidence from a multi-scale ecological suitability assessment. Scientific Reports. 8(1):14083.
Stoyan D, Penttinen A. 2000. Recent applications of point process methods in forestry statistics. Statistical science. 15(1):61-78.
Sun S, Kang XP, Tian YS, Zheng SW, Hao RJ, Liu QL, Zhang JC, Xing GM. 2012. Molecular analysis of differentially expressed genes in birch (Betula Platyphylla) inflorescence. Biotechnology and Biotechnological Equipment. 26(2):2844-2854.
Sun WT, Yu DD, Dong ML, Zhao J, Wang XP, Zhang HJ, Zhang JF. 2017. Evaluation of efficiency of controlled pollination based parentage analysis in a Larix gmelinii var. principis-rupprechtii Mayr. seed orchard. Plos One. 12(4):e0176483.
Takahashi K, Rustandi A. 2006. Responses of crown development to canopy openings by saplings of eight tropical submontane forest tree species in Indonesia: A comparison with cool-temperate trees. Annals of Botany. 97(4):559-569.
Tilman D. 1982. Resource competition and community structure. Princeton University Press, Princeton, New Jersey, USA.
Truong C, Palme AE, Felber F. 2007. Recent invasion of the mountain birch Betula pubescens ssp. tortuosa above the treeline due to climate change: genetic and ecological study in northern Sweden. Journal of Evolutionary Biology. 20(1):369-380.
Valiente-Banuet A, Verdú M. 2008. Temporal shifts from facilitation to competition occur between closely related taxa. Journal of Ecology. 96(3):489-494.
Wang Y, Wu H. 2017. Transition of interaction outcomes in a facilitation-competition system of two species. Mathematical Biosciences and Engineering. 14:1463-1475.
Wang ZH. 2001. Water and soil loss and ecological rehabilitation in mountain areas of Hebei. Research of Soil and Water Conservation. 8(2):88-89.
Weigand T, Moloney KA. 2014. Handbook of spatial point-pattern analysis in ecology, CRC Press: London, UK.
Wiegand T, Moloney KA. 2004. Rings, circles, and null-models for point pattern analysis in ecology. Oikos. 104(2):209-229.
Xia ZC, Kong CH, Chen LC, Wang P, Wang SL. 2016. A broadleaf species enhances an autotoxic conifers growth through belowground chemical interactions. Ecology. 97(9):2283-2292.
Yilmaz OY, Kavgacı A, Sevgi O, Örtel E, Tecimen HB, Çobanoğlu A, Yeşil İ. 2019. Scale-dependent intraspecific competition of Taurus cedar (Cedrus libani A. Rich.) saplings in the Southern Turkey. Ecology and Evolution. 9(22):12802-12812.
Yuan Y, Ren Y, Gao G, Zhao Z, Niu S. 2020. Intra- and interspecific interactions among pioneer trees affect forest-biomass carbon accumulation in a nutrient-deficient reclaimed coal mine spoil. Forests. 11(8):819.
Zhang H, Yu Y, Zha T, Jesús RC. 2021. Assessing previous land-vegetation productivity relationships on mountainous areas hosting coming Winter Olympics Games in 2022. Science of the Total Environment. 788:147870.
Zhang K, Shen Z, Yang X, Ma L, Duan J, Li Y. 2019. Spatial patterns in different stages of regeneration after clear-cutting of a black locust forest in central China. Forests. 10(12):1066.
Zhang ZH, Hu G, Zhu JD, Luo DH, Ni J. 2010. Spatial patterns and interspecific associations of dominant tree species in two old-growth karst forests, SW China. Ecological Research. 25(6):1151-1160.
Zhou Q, Shi H, Shu X, Xie F, Zhang K, Zhang Q, Dang H. 2019. Spatial distribution and interspecific associations in a deciduous broad-leaved forest in north-central China. Journal of Vegetation Science. 30(6):1153-1163.
Zillio T, He F. 2010. Modeling spatial aggregation of finite populations. Ecology. 91(12):3698-3706.
Supplementary Material

Table A1: Statistical results and normality test of tree height (H) according to DBH size classes.
Tabelle A1: Statistische Ergebnisse und Normalitätstest der Baumhöhe (H) nach DBH-Größenklassen.

Figure A1: Images of stand structure for (a) PB, (b) PL, and (c) BL.
Abbildung A1: Bilder von Waldtstruktur für (a) PB, (b) PL und (c) BL.

Figure A2: Scatter plots of DBH and tree height (H) in (a) PB, (b) PL, and (c) BL. Black color represents birch trees and red color represents larch trees. The black curves are fitted with the Power functions.
Abbildung A2: Streudiagramme von DBH und Baumhöhe (H) in (a) PB, (b) PL und (c) BL. Die schwarze Farbe steht für Birken und die rote Farbe für Lärchen. Die schwarzen Kurven sind mit den Power-Funktionen angepasst.

Figure A3: Univariate pair correlation functions g(r) of (a) birch trees in PB, (b) larch trees in PL, (c) birch trees in BL, and (d) larch trees in BL. Black lines indicate the observed g(r), and blue lines indicate the 99% Monte Carlo envelopes.
Abbildung A3: Univariate Paarkorrelationsfunktionen g(r) von (a) Birken in PB, (b) Lärchen in PL, (c) Birken in BL und (d) Lärchen in BL. Schwarze Linien zeigen die beobachteten g(r) an, und blaue Linien zeigen die 99% Monte-Carlo-Hüllkurven an.

Figure A4: Univariate mark correlation functions kmm(r) for the intraspecific association of tree height between different life stages. Black lines indicate the observed kmm(r), and blue lines indicate the 99% Monte Carlo envelopes. (a) Birch saplings in PB; (b) birch juveniles in PB; (c) birch adults in PB; (d) larch juveniles in PL; (e) larch adults in PL; (f) birch saplings in BL; (g) birch juveniles in BL; (h) birch adults in BL; (i) larch juveniles in BL; (j) larch adults in BL.
Abbildung A4: Univariate Markenkorrelationsfunktionen kmm(r) für die intraspezifische Assoziation der Baumhöhe zwischen verschiedenen Lebensstadien. Schwarze Linien zeigen die beobachteten kmm(r), und blaue Linien zeigen die 99% Monte Carlo Hüllkurven. (a) Birkenjungbäume in PB; (b) heranwachsende Birken in PB; (c) ausgewachsene Birken in PB; (d) heranwachsende Lärchen in PL; (e) ausgewachsene Lärchen in PL; (f) Birkenjungbäume in BL; (g) heranwachsende Birken in BL; (h) ausgewachsene Birken in BL; (i) heranwachsende Lärchen in BL; (j) ausgewachsene Lärchen in BL.


