Schlüsselbegriffe: kosteneffizientes Design, Waldinventur, offener lichter Eichenwald, Quercus brantii, Zagros Wald
Available at https://doi.org/10.53203/fs.2302.1
See below the issue 2/2023 as E-Paper or have a look at our E-Paper archive dating back to 1955.
This work is licensed under a Creative Commons Attribution-ShareAlike 4.0 International License.
Abstract
If available forest inventory techniques or measurement instruments are not satisfying or appropriate for monitoring a particulare forest, options include developing a new inventory technique and/or modifying an available instrument. In this study, we present a new application of horizontal line sampling (HLS) in combination with a crown relascope as a potential alternative to line intersect sampling (LIS) to monitor coppice forests (CF). In CFs, the stem basal area relascope is not applicable, since trees often lack distinct stems and are not visible at breast height. Our study was conducted in an open oak-dominated CF in western Iran and we focussed on two forest attributes: above-ground biomass (AGB) and the total number of trees (N). We assessed the field performance of HLS and LIS in CFs and evaluate various line transect lengths and crown relascope angles. Our results indicate that longer line transects (80 m) produce smaller relative sampling errors compared to shorter ones (20 m) and smaller relascope angles (36.8°) are more precise than larger ones (67.4°). In terms of cost-efficiency, HLS is superior or equivalent to LIS in some cases. While HLS and LIS gave different estimates of AGB and N, the difference was not statistically significant at the 95% level. Both relascope angle and line transect length impact the efficiency of HLS. Our study provides evidence that this technique can be useful for monitoring forest conditions.
Zusammenfassung
Wenn verfügbare Waldinventurtechniken und/oder Messinstrumente nicht geeignet sind, um ein ausgewähltes Waldgebiet zu beobachten, dann ist eine Lösung, neue Inventurtechniken zu entwickeln und/oder verfügbare Messinstrumente zu adaptieren. In dieser Studie stellen wir eine neue Anwendung der horizontalen Linienstichprobe (HLS) in Kombination mit einem Kronenrelaskop vor. Als potenzielle Alternative zur Linienkreuzungsstichprobe (LIS) testen wir hier die HLS in Ausschlagwäldern (CF). In niederwaldähnlichen Ausschlagwäldern ist das Stammgrundflächenrelaskop nicht anwendbar, da Bäume oft keine ausgeprägten Stämme haben und in Brusthöhe oft nicht sichtbar sind. Die Studie wurde in einem offenen und von Eichen dominierten Ausschlagwald im westlichen Iran durchgeführt. Die Studie fokussiert sich auf zwei Waldattribute, oberrirdische Biomasse (AGB) und die Gesamtzahl der Bäume (N). Wir bewerten die Leistungsfähigkeit von HLS- und LIS-Inventurtechniken in CF sowie den Effekt verschiedener Transektlängen und Kronenrelaskopwinkel. Unsere Ergebnisse zeigen, dass eine längere Transektlänge (80 m) einen kleineren relativen Stichprobenfehler aufweist als die kürzere Transektlänge (20 m) und ein kleinerer Relaskopwinkel (36,8°) präziser ist als ein größerer Relaskopwinkel (67,4°). Hinsichtlich der Kosteneffizienz ist HLS der LIS überlegen oder in einigen Fällen gleichwertig. HLS und LIS ergaben unterschiedliche Schätzungen von AGB und N, aber der Unterschied war statistisch nicht signifikant auf dem 95-%-Niveau. Sowohl Relaskopwinkel als auch Transektlänge haben Auswirkungen auf die Effizienz des HLS. Unsere Studie liefert einen Beleg, dass die HLS-Technik für das Monitoring des Waldzustandes hilfreich sein kann.
1 Introduction
A larger number of forest inventory techniques have been proposed to collect the necessary information for forest management planning. In forest inventories, the primary objective is to estimate the parameters with the highest possible accuracy/precision and at a reasonable cost (Kershaw et al. 2016). However, a given forest inventory technique and/or measurement instrument may not be efficient when applying it in different situations and for various purposes. The characteristics of the forest, survey´s objective and costs determine the appropriate inventory technique and measurement instrument to be used. For instance, Schreuder et al. (1987) suggested that HPS is a highly effective technique in estimating stand-level basal area, but it may be less effective in estimating other parameters such as tree density. To improve precision in the estimation of snags, Ducey et al. (2002) utilized a combination of horizontal point sampling (HPS) and horizontal line sampling (HLS). Hence, developing a new inventory technique or modifying the currently used measurement instrument to suit various situations is desirable.
Unlike forests, where a stand is characterized by single-stemmed trees that originate from seed, there is another form of forest around the world, so-called coppice forest (CF) (Scolastri et al. 2017). CF consist of trees that have mainly been regenerated from shoots and a small percentage of seed-originated trees (Scolastri et al. 2017; Iranmanesh et al. 2019). Young tree stems are repeatedly cut down to near ground level, resulting in a stool. These stands are formed through asexually/vegetatively sprouting, which is the most common means of regeneration (Vollmuth 2022).
CF are an important renewable resource, with the potential to provide products and services such as non-wood products, protection and heritage ecosystem services. While seed-originated trees have short stems and large crowns (Scolastri et al. 2017), in CFs shoots-regenerated trees often lack a distant stem. Vollmuth (2022) conducted a survey in Germany’s coppice forest. The author concluded that coppice forests have high overall biodiversity and that they provide habitats for numerous light-demanding species, that are endangered today.
The stem basal area relascope is a commonly used instrument in forest inventory for estimating variables such as basal area (BA) and volume (Bitterlich 1984; Lynch et al. 2021). However, in CFs, where trees generated through sprouting and do not have distinct stems, the stem basal area relascope may not be as effective due to the invisibility of the stems in breast height. To address this issue, the crown relascope (CrR, Stenberg et al. 2008) may be an efficient alternative. The CrR is an extension of the stem basal area relascope. CrR estimates vertically projected crown area on the ground or crown cover using tree crown diameter as the criterion for selection. However, the use of CrR requires a larger basal area factor known as the crown basal area factor (CBAF).
Line intersect sampling (LIS) is a well-known and efficient technique for sampling different kinds of features (Kaiser 1983, DeVries 1986, Skidmore and Turner 1992). It has been used for measuring the area of two-dimensional objects (Battles et al. 1996, Ramezani & Holm 2011), in estimating total length of linear features (e.g., Matérn 1964, Corona et al. 2004, Ramezani & Holm 2011), and also to estimate the total number of objects (Gregoire & Valentine 2008). However, LIS may not be efficient for sparse populations (Cooper 1957; Ståhl 1997). In such a population, we may encounter one of the two following situations: either there is a need for a large sample size, or the estimated sampling error (or variance) will be large (Ducey et al. 2002).
Horizontal line sampling (HLS) was originally developed by Strand (1957) to estimate attributes of standing trees. Lynch (2006) and Marquardt et al. (2010) applied HLS to estimate total amounts of forest attributes in riparian forests. Rice et al. (2014) found that HLS was also effective in partially harvested stands, and it has also been used in forest inventory in Taiwan (Yang & Chao 1987). In HLS, Bitterlich sampling (1984) and LIS features are combined and a stem basal area relascope is often used in estimating forest parameters (Schreuder et al. 1987; Gregoire & Valentine 2008). For quantifying coarse woody debris in a sparse population, Ståhl (1997) developed a transect relascope (TR), which combines LIS and a wide-angle relascope instead of the stem basal area relascope. The method section (2.2) provides detailed description of the estimators and inclusion probabilities of both LIS and HLS.
In previous examples of HLS applications, the same instrument – a stem basal area relascope – was generally used as in horizontal point sampling (HPS). However, this study presents a new application of HLS in combination with CrR in a coppice forest. The study compares the field performance, precision, and time efficiency of HLS and LIS inventory techniques. The main objective is to estimate forest attributes such as above-ground biomass (AGB) and the total number of trees (N) in a CF where trees do not have distinct stems. Additionally, the study assesses the performance of HLS and LIS at varying transect lengths (80, 40, and 20 m) and relascope angles (36.8, 53.1, and 67.4°). While sample size has an obvious effect on the precision of estimates, it is not examined in this study.
2 Material and methods

Figure 1: Location of the study area; a) overview of Iran; b) province; c) distance to nearby city; and d) the study area in an open oak stand.
Abbildung 1: Lage des Untersuchungsgebiets; a) Überblick über Iran, b) Provinz, c) naheliegende Stadt und d) das Untersuchungsgebiet in einem offenen Eichenbestand.
2.1 Study area
The study was conducted in an open, oak-dominated coppice forest (CF) (Quercus brantii) in Lorestan province, western Iran (Zagros forests, see Fig. 1). Quercus brantii is a significant tree species in the western forests of Iran. These oak stands are often found mixed with Juniperus excelsa M. Bieb, Amygdalus scoparia Spach., Pistacia atlantica Desf. and Acer monspessulanum L. Due to human impact, only 7% of the oak forests are considered forests, while the remaining 93% are in coppice form (Iranmanesh et al. 2019; Mahdavi et al. 2020). We note that according to FAO, forest land is defined as land covering more than 0.5 hectares with trees higher than 5 meters and a canopy cover of more than 10 percent. Zagros forests cover an area of approximately 5 million hectares and are classified as semi-arid, accounting for 40% of Iran’s forests. The elevation of the study area ranges from 1860 m to approximately 2070 m above sea level, with a mean annual precipitation of 530.15 mm and a mean annual temperature of 18.3° C (Sagheb-Talebi et al. 2003). Zagros forests are non-timber-oriented and provide valuable ecosystem services such as water resources, climate regulation, and biodiversity conservation. The social economy of Zagros forests is closely linked to the sustainable use and management of the forest ecosystem, with activities including ecotourism, handicrafts, and value-added processing of forest products (Salehi 2009; Riyahi 2010). CFs have been a crucial source of energy in the form of firewood and charcoal for rural people for thousands of years. Animal husbandry is a common land use practice in the Zagros forest (Safari & Sohrabi 2019). Fire frequently occurs in the Zagros forest during the summer and early autumn months. This fire season coincides with the dry and hot periods. Wildfires play a natural role in maintaining forest health and biodiversity. Some tree species in the Zagros forest have adapted to fire and depend on it for their regeneration and growth (Javanmiri pour 2021).

Figure 2: Illustration of a crown relascope with reach-to-width 1:1 ratio (relascope angle 53.1°) and crown basal area factor 2500 (m2 ha-1). W and R are relascope width and distance length of string, respectively.
Abbildung 2: Darstellung eines Kronenrelaskops mit einem Verhältnis von Reichweite zu Breite von 1:1 (Relaskopwinkel 53,1°) und einem Kronengrundflächenfaktor von 2500 (m2 ha-1). W und R sind die Schlitzlänge und die Länge des Fadens des Relaskops.
2.2 Sampling design
In this study, we laid out a systematic array of 25 m × 25 m line grids over the study area (about 10.4 ha) in a GIS environment. A total of 166 points were located in the study area, of which 30 were randomly selected and established in the field using a global positioning system (GPS). These locations served as the midpoints of the line transects. The transects were laid out using measuring tape and a hand compass, with orientations determined according to a uniform distribution [0, 2π]. To avoid boundary bias, we applied the walk-back method (Gregoire & Valentine 2008, p. 299), where if a boundary is intersected by a transect, the intersection point with the boundary serves as the starting point and we walk back towards the original sampling location.
We made a simple crown relascope (CrR) using wooden pieces and string (Fig. 2). A common and practical way to determine the desired angle for constructing a relascope is to use a reach-to-width ratio (R:W) (Table 1). Using CrR, the crown basal area factor (CBAF, m2 ha-1) is the amount of crown basal area per hectare that each sampled tree represents. Under CrR, crown cover (CrC) can be estimated by counting the average number of tree crowns (t) that appear wider than the crown relascope’s angle and multiplying the result by a predefined CBAF (m2 ha-1), CrC = t × CBAF. For instance, CBAF 2500 (m2 ha-1) means that one tallied tree corresponds to 2500 m2 of crown cover area per hectare.

Table 1: Reach-to-width ratio (R:W) and crown basal area factor (CBAF) for three HLS designs. tan(V/2)2 =(W/2)2/(R)2=k, and CBAF (m2ha-1)=10000×k.
Tabelle 1: Verhältnis von Reichweite zu Breite (R:W) und Kronengrundflächenfaktor (CBAF) für drei HLS-Designs. tan(V/2)2=(W/2)2/(R)2=k, und CBAF (m2 ha-1)=10000×k.
The next section provides a brief overview of the inclusion probabilities of trees when using LIS and HLS, as well as the estimators associated with these inventory techniques.
a) Line intersect sampling (LIS)
In LIS, the surveyor walked along the line transects and an object (tree) was included in the sample if the tree crown projected on the ground crossing a line transect. Then, the crown diameter of the selected trees was measured using measuring tape.
In a random sampling design (as our case), the inclusion probability of tree i (πi,LIS), is:

where cdi (m) is the tree crown diameter of tree i, l is transect length (m), and A is the total area (ha) (see Fig. 3, right).
The Horvitz-Thompson (HT) estimator of LIS to estimate the total above-ground biomass (AGB) for a single sampling unit, j (line transect) is

and to estimate the total number of trees (N) the estimator is

where, AGBi (kg) is the above-ground biomass of tree i, and m is the total number of trees sampled in the j th line.
A general HT estimator for the population total in a sample of n lines (the averaging across n sampling units) is

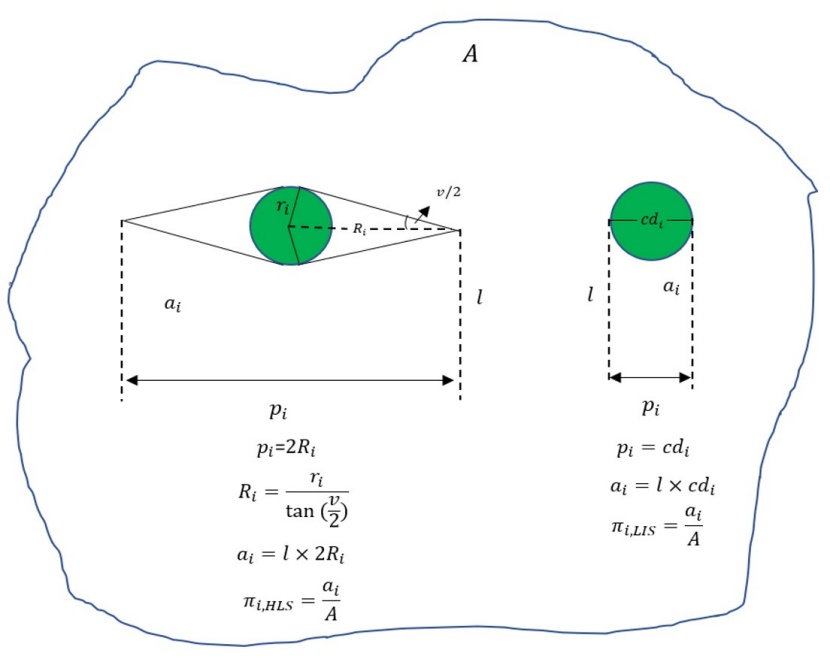
Figure 3: An illustration of the inclusion probabilities, under random sampling design, in the LIS and HLS cases. cdi is corresponding the tree crown diameter tree i, ri is corresponding crown radius of tree i, Ri is limiting distance of tree i, l is transect length, v is the fixed sighting angle of the relascope and ai is the inclusion area of tree i. The line intersects sampling (LIS, right), the horizontal line sampling (HLS, left).
Abbildung 3: Eine Illustration der Einbeziehungswahrscheinlichkeiten bei zufälligem Stichprobendesign in den Fällen LIS und HLS. cdi entspricht dem Kronendurchmesser des Baumes i, ri entspricht dem Kronenradius des Baumes i, Ri ist der Grenzabstand des Baumes i, l ist die Transektlänge, v ist der feste Sichtwinkel des Relaskops und ai ist die Einbeziehungsfläche des Baumes i. Die Linie schneidet die Stichprobe (LIS, rechts), die horizontale Linie Stichprobe (HLS, links).
b) Horizontal line sampling (HLS)
In HLS, crown relascope (Fig. 2) was used when the same surveyor walking along the same line transects as in LIS. The surveyor sighted both sides of the transects and viewed all candidate trees through the relascope angle. Any tree with crown diameter greater than the width of the projected angle from the relascope was chosen as a sample tree. In this way, trees were sampled with probability proportional to their crown basal area. Note that we adopted modified sausage sampling (Gregoire & Valentine 2008, p 362), where trees selected from the sample locations were omitted. Thus, in such a procedure, the inclusion probability is the same as under the conventional HLS.
Under HLS procedure, tree i, is selected if its perpendicular distance from the transect is within a limiting distance (Ri). In contrast to LIS, a tree is selected into a horizontal line sample without crossing directly by line transects. Under HLS, the inclusion probability of tree i (πi,HLS), in a random sampling design, is (see Fig. 3, left):

where Ri (m) is the limiting distance from which a tree appears exactly as wide as the measurement instrument that defines the sighting angle. According to Stenberg et al. (2008), Ri for crown relascope can be calculated as:

where ri (m) is the tree crown radius of tree i, and V is relascope angle determined by the measurement instrument and a design parameter that is constant for all trees. Thus, the inclusion probability πi,HLS can be expressed with replacing Ri as:

Using HLS, the HT estimator of AGB for a single sampling unit, j is:

and the estimator of N for a single sampling unit, j is:

In the case of HLS, the estimator of the population total in a sample of n lines is:

For both attributes ABG and N the average per hectare can be estimated with

In the study, we predicted tree-level biomass using the following equation fitted by Iranmanesh et al. (2014). The equation is based solely on the tree-level crown diameter and is defined as

where cd is the tree crown diameter (m). The authors developed Equation 11 using 30 sampled Quercus brantii trees. They found a strong and nonlinear relationship (R2 = 0.97) between above ground biomass (AGB) and tree crown diameter (cd). The study area had a mean annual rainfall sum of 567 mm and a mean annual temperature of 15.5 °C.
2.3 Time study
The study recorded the time required in seconds per length unit for data acquisition, including measuring the diameter of the crown projected on the ground of sampled trees using a standard tape and walking to the sample trees. The work was carried out by a three-person crew.
2.4 precision assessment
As both inventory techniques offer design-unbiased estimates for the population total N and AGB, the comparison between the two techniques was based on the smallest cost-variance. The variability between line transects was used to characterize the sampling variability on the total estimates. The estimator of variance of the population total, τˆy is defined as (Thompson 2002):

where τˆy, j is individual estimate of the population total of a single transect, j and τˆy is the average of the all n transects. The relative sampling error (SE %) for the population

It should be noted that the sample size for all combinations of three relascope angles and three line transect lengths was the same (i.e., 30 line transects).
2.5 Efficiency evaluation
The relative efficiency (RE) method is a commonly used approach to assess the efficiency of different forest inventory techniques (Husch, 1963), where both costs (time) and sampling error are considered. By this method, a forest inventory technique (here LIS), serves as the reference. RE can be computed by:

where %SEHLS and %SELIS are the relative sampling errors of HLS and LIS, respectively. THLS and TLIS are the total time needed for inventory techniques HLS and LIS, respectively. When RE < 1, HLS is more efficient than LIS; when E > 1, the converse is true.
Standard statistical procedures were employed to analysis the data. Specifically, a one-way ANOVA was used to test for significant differences between the inventory techniques sued to estimate N and AGB. Additionally, a multiple regression analysis was conducted to examine the combined effect of predictor variables-line length and relascope angle-on response variable SE %.
3 Results
Figure 4 shows the estimates of the total N and AGB obtained using inventory techniques tested. The error bars represent confidence intervals. Although HLS and LIS produced different estimates, the difference was not statistically significant at a 90% confidence level (p=0.874 and p=0.876 for N and AGB, respectively), as shown in Tables A1 and A2. This result can be expected, since both inventory techniques are design-unbiased. In most cases, longer line transects resulted in smaller confidence intervals.

Figure 4: Estimates of the total N (top) and AGB (bottom) using LIS and HLS. Inclusion angles (V1, V2, V3) and three line transect lengths. The error bars indicate the range within which we are 90% confident that the true value lies. This was determined using data from 30 line transects. The figures represent the total estimates for a 10 hectare area.
Abbildung 4: Schätzungen von N (oben) und AGB (unten) unter Verwendung von LIS und HLS. Einbeziehungswinkel (V1, V2, V3) und drei Linientransektlängen. Fehlerbalken repräsentieren die Konfidenzintervalle und die Ergebnisse wurden aus einer Stichprobengröße von 30 Linientransekten gewonnen. Die Zahlen repräsentieren die Gesamtschätzungen für eine Fläche von 10 Hektar.
Figure 5 displays the relative sampling errors (SE%) for N and AGB using two inventory techniques (LIS and HLS), three line transect lengths, and three relascope angles. In general, HLS is more precise than LIS. This result is expected since HLS covers a larger stand area than a comparable LIS, increasing the probability of sampling more trees. Additionally, in most cases, longer line transects result in lower relative sampling errors (SE%).

Figure 5: Relative sampling error (SE%) of HLS with three inclusion angles (V1, V2, V3) compared to LIS for N (top) and AGB (bottom).
Abbildung 5: Relativer Stichprobenfehler (SE%) von HLS mit drei Einbeziehungswinkeln (V1, V2, V3) im Vergleich zu LIS für N (oben) und AGB (unten).
The results of the multiple regression analysis, shown in Figure 6, indicate a negative relationship between the relative sampling error (SE%) and line transect length. This implies that an increase in the length of the line transect is associated with a decrease in the SE%. Conversely, there is a positive relationship between SE% and relascope angle, which means that an increase in the relascope angle is associated with an increase in the SE%.
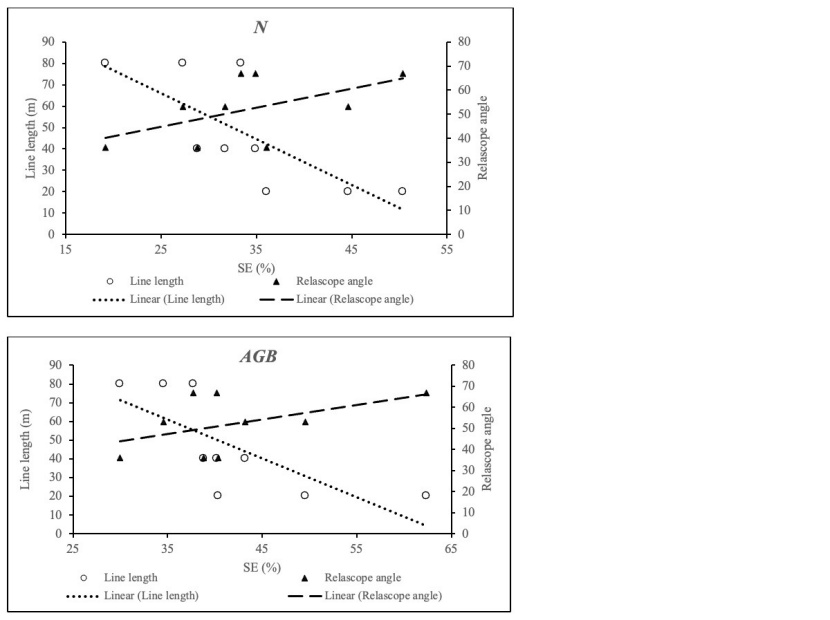
Figure 6: The relationship between SE% and relascope angle and line length for both N (top) and AGB (bottom).
Abbildung 6: Die Beziehung zwischen SE% und Relaskopwinkel und Linienlänge für N (oben) und AGB (unten).
Table 2 provides the average time (in seconds per meter) for two inventory techniques and three relascope angles. It is important to note that the walking costs between sampling lines were not included.

Table 2: The average time needed to measure one meter of transect length for two inventory techniques and three different relascope angles, V (°).
Tabelle 2: Die durchschnittlich nötige Zeit, um einen Meter Transektlänge zu messen für zwei Inventurtechniken und drei verschiedene Relaskopwinkel, V (°).
Table 3 presents the relative efficiency (RE%) of three line transect lengths and three relascope angles. In some cases, the RE is less than or equal to 1. This indicates that in these cases, HLS is superior to LIS.

Table 3: Relative efficiency (RE) of three transect lengths and three relascope angles. In bold print, HLS is superior or equivalent to LIS in terms of cost-%SE.
Tabelle 3: Relative Effizienz (RE) von drei Linienlängen und drei Relaskopwinkeln. Fettgedruckte Zahlen zeigen, dass HLS überlegen oder gleichwertig ist zu LIS in Bezug auf Kosten-%SE.
4 Discussion
Monitoring forest change and forest degradation is important in sustainable development and management of forest landscapes (Li et al. 2021). Therefore, efficient collection of forest information will play a significant role in improving the management of forest landscape (Moradi et al. 2022).
4.1 Estimation of N and AGB
The application of horizontal line sampling (HLS) in coppice forests, particularly in combination with crown relascope, is novel. As a result, there was no prior knowledge of an appropriate crown basal area factor (CBAF) and its impact on estimates. CBAF was determined by practical convenience. Previous studies have shown that estimates of forest attributes are highly related to basal area factor (BAF) when using horizontal point sampling (HPS) (Brooks 2006; Lindemuth 2007). Our results show that there is no significant difference among the three CBAFs tested in estimating the total number of trees (N) and above-ground biomass (AGB). Thus, choosing much larger or smaller CBAFs may lead to significant estimates of N and AGB.
In this study, it is impossible to determine the most accurate inventory technique due to the lack of a reference value for N and AGB. Further simulation studies are needed to determine the most accurate inventory technique in coppice forests. Under a simulation study, it is also possible to test very large or small CBAFs.
4.2 Statistical properties
In general, line intersect sampling (LIS) resulted in higher variance, which was expected as the inclusion zone for trees in LIS – the “imaginary rectangle” – is smaller than in horizontal line sampling (HLS). Our results indicate that, in most cases, HLS is more efficient than LIS in terms of relative sampling error (SE %). This finding is consistent with Stenberg et al. (2008), where a Crown Relascope (CrR) was compared to LIS for estimating crown cover area in boreal forests. However, the authors combined CrR with horizontal point sampling (HPS) and did not consider costs.
Although horizontal line sampling (HLS) with V1 resulted in the smallest sampling error for all three line lengths and for both the total number of trees (N) and above-ground biomass (AGB) (Fig. 5), it is not cost-effective. This is because many trees are sampled, making it time-consuming to use V1. One way to overcome this drawback – the walking time to sampled trees – is to use ground-based horizontal laser scanning to measure tree crown diameter. As our results show, HLS is superior to line intersect sampling (LIS) in terms of variance (Fig. 5). However, in terms of cost-efficiency, HLS is not effective in some cases because it is more time-consuming than LIS (Table 3).
4.3 Relationship between sampling error and line length and relascope angle
Our results indicate that both relascope angle and line length impact the relative sampling error (SE %). Rice et al. (2014) also found that for a given line length, a larger relascope angle can produce a higher sampling error. Our results suggest that longer line transects and/or smaller relascope angles lead to better precision estimates. However, Schreuder et al. (1987) found in a simulation study that longer lines with a large angle can be efficient, which they attributed to dense undergrowth in the study area - a factor not present in our study. Previous studies have shown that HLS is equivalent or superior to HPS in various respects (e.g., Ríos et al. 2000; Schreuder et al. 1987). Kenning et al. (2005) found that HLS was more efficient in sampling basal area compared to fixed area sampling. However, no comparison study has been conducted between HLS and LIS, making direct comparison of results difficult.
A wide-angle relascope was used by Cooper (1957, 1963) and Stenberg et al. (2008) to estimate the number of shrubs (N) and canopy cover area (CCA) in shrubland and boreal forest stands, but the authors applied HPS. They found that HPS was also superior to LIS. Using HPS, CCA can be estimated simply by counting sampled trees and multiplying by a constant expansion factor – the crown basal area factor. However, to estimate other forest attributes such as above-ground biomass (AGB) and N, the tree crown diameter of sampled trees must be measured.
4.4 Caveats and shortcomings
There are several sources of bias when using Horizontal Line Sampling (HLS): (a) deviations from the line transect when walking along it; (b) not operating the relascope horizontally; (c) overlapping of tree crowns; and (d) non-circularity of tree crowns. As Stenberg et al. (2008) concluded, CrR appears to be effective and applicable in forest stands where there is no overlapping of tree crowns. Fortunately, this is the case in our study area – a low-density, open coppice forest. Ståhl (1997) also found that the relative superiority of HLS was larger in populations where the intensity of population elements was low. The last source of bias was not included in this study, but it would be an interesting research topic to explore the extent of bias. For this purpose, a true value is needed.
4.5 A vision for the future of HLS and crown relascope research
In this study, line transects were established randomly. However, Gregoire and Valentine (2008) describe a systematic alternative for deriving element inclusion probabilities and corresponding estimators. Under a systematic design, the probability of including a tree depends on the width of the inclusion area for the tree in a direction perpendicular to the sample line. One advantage of a systematic sampling design is that it allows for the estimation of total without the need for the total area of the study tract (Lynch, 2006).
In this study, the sample size is fixed (i.e., 30 line transects). However, it is well-known that sample size can substantially impact the precision of estimates. Woldendorp et al. (2004) and Ramezani and Holm (2010) demonstrated in simulation surveys how sample size and line transect length can influence the precision of estimates. It would be interesting to conduct a similar survey for CrR and HLS, considering a combination of different sample sizes, line transect lengths, and relascope angles. It would also be interesting to compare crown relascope to fixed-area sampling, a widely used forest inventory technique.
5 Conclusions
In this study, we explored a new application of Horizontal Line Sampling (HLS) in combination with CrR to estimate attributes of coppice forests (CFs). Our suggested combination is easy to implement in the field and, in some cases, more efficient than Line Intersect Sampling (LIS) for estimating forest attributes in CFs. While this study focused on standing trees, we speculate that HLS and CrR may also be useful for inventorying other sparse populations such as downed wood in CFs.
Both relascope angle and line transect length impact the performance of HLS. The technique used in our research may be replicated in other CFs with similar characteristics and stand structures. Our study provides evidence that this technique can also support forest degradation monitoring.
Acknowledgment
We would like to express our gratitude to four anonymous reviewers for their valuable comments on the manuscript.
Reference
Battles J., Dushoff G. and Fahey J. (1996). Line intersects sampling of forest canopy gaps. Forest Science 42:131-138
Bitterlich, W. 1984. The relascope idea: relative measurements in forestry. Commonwealth Agricultural Bureaux, Farnham Royal, Slough, UK.
Brooks J.R. 2006. An evaluation of big basal area factor sampling in Appalachian hardwoods. North J Appl For 23(1):62–65
Cooper, C.F., 1957. The Variable Plot Method for Estimating Shrub Density. Rangeland Ecology & Management/Journal of Range Management Archives, 10(3), pp.111-115.
Cooper, C.F., 1963. An evaluation of variable plot sampling in shrub and herbaceous vegetation. Ecology, 44(3), pp.565-569.
DeVries P.G. (1986). Sampling theory for forest inventory. SpringerVerlag, Berlin, Germany.
Ducey, M.J., Jordan, G.J., Gove, J.H. and Valentine, H.T., 2002. A practical modification of horizontal line sampling for snag and cavity tree inventory. Canadian Journal of Forest Research, 32(7), pp.1217-1224.
Gregoire, T.G. and Valentine, H.T., 2008. Sampling strategies for natural resources and the environment. Chapman and Hall/CRC.
Iranmanesh, Y., et al., 2014. Biomass and carbon stocks of brants oak (Quercus brantii Lindl.) in two vegetation forms in Lordegan, Chaharnahal & Bakhtiari Forests. Iranian Journal of Forest and Research, 22, 762-749.
Iranmanesh, Y., Sohrabi, H., Talebi, K.S., Hosseini, S.M., Safari, H. and Abouzar, K., 2019. Biomass Expansion Factor (BEF) and Carbon Stock for Brant’s Oak (Quercus brantii Lindl.) Forests of West-Iran. Annals of Silvicultural Research, 43(1), pp.15-22.
Javanmiri pour, M. 2021. Fire characteristics of Zagros forest ecosystem, Kermanshah province, western Iran. Environment & Ecosystem science 5(2):94-100
Kershaw Jr, J.A., Ducey, M.J., Beers, T.W. and Husch, B., 2016. Forest mensuration. John Wiley & Sons.
Kenning, R.S., Ducey, M.J., Brissette, J.C., Gove, J.H., 2005. Field efficiency and bias of snag inventory methods. Can. J. Forest Res. 35, 2900-2910.
Lister AJ, Leites LP 2021. Cost implications of cluster plot design choices for precise estimation of forest attributes in landscapes and forests of varying heterogeneity. Canadian journal of forest.
Lindemuth RM 2007. A field trial comparison of sampling methods for estimating basal area and volume in partially harvested stands in Maine. MS Thesis, The University of Maine, Orono, ME.
Lynch, T.B. 2006. Horizontal Line Sampling for Riparian Forests without Land Area Estimation, Forest Science, Volume 52, Issue 2, pp.119-129, https://doi.org/10.1093/forestscience/52.2.119
Lynch, T.B., 2016. Optimal plot size or point sample factor for a fixed total cost using the Fairfield Smith relation of plot size to variance. Forestry: An International Journal of Forest Research, 90(2), pp.211-218.
Mahdavi, A., Saidi, S., Iranmanesh, Y. and Naderi, M., 2020. Biomass and carbon stocks in three types of Persian oak (Quercus brantii var. persica) of Zagros forests in a semi-arid area, Iran. Journal of Arid Land, 12(5), pp.766-774.
Matérn B. (1964). A method of estimating the total length of roads bymeans of line survey. Studia forestalia Suecica 18:68-70
Marquardt, T., Temesgen, H., and Anderson, P.D. 2010. Accuracy and suitability of selected sampling methods within conifer dominated riparian zones. For. Ecol. Manage. 260(3): 313–320. doi:10.1016/j.foreco.2010.04.014
Moradi, F., Sadeghi, S.M.M., Heidarlou, H.B., Deljouei, A., Boshkar, E. and Borz, S.A., 2022. Above-ground biomass estimation in a Mediterranean sparse coppice oak forest using Sentinel-2 data. Annals of Forest Research, 65(1), pp.165-182.
Ramezani, H., Holm, S., Allard, A. and Ståhl, G., 2010. Monitoring landscape metrics by point sampling: accuracy in estimating Shannon’s diversity and edge density. Environmental Monitoring and Assessment, 164(1), pp.403-421.
Ramezani H & Holm S. 2011. Sample based estimation of landscape metrics: accuracy of line intersect sampling for estimating edge density and Shannon’s diversity. Environ Ecol Stat. 18:109-130.
Riyahi, H. R. 2010. Evaluation of the Capability of Quickbrid Data for Automatic
Delineation of Individual Tree Crowns in Sparse Deciduous Forests, Case-Study in the Zagros Region of Iran Georg-August University Göttingen, Location.
Rice, B., Weiskittel, A.R., Wagner, R.G., 2014. Efficiency of alternative forest inventory methods in partially harvested stands. Eur. J. Forest Res. 133, 261-272.
Safari, A., & Sohrabi, H. (2019). Effect of climate change and local management on aboveground carbon dynamics (1987–2015) in Zagros oak forests using Landsat time-series imagery. Applied Geography, 110(December 2018). https://doi.org/ 10.1016/j.apgeog.2019.102048, 102048.
Salehi, A. 2009. Livelihood Dependensy and Management on Semiarid Oak Forests (Zagros Forests). Faculty of forest sciences, Department of Forest Resource Management, Location
Sagheb Talebi, K., Toktam Sajedi, T, Pourhashemi, M. 2013. Forests of Iran: A Treasure from the Past, a Hope for the Future. Springer Netherlands, 10.
Scolastri, A., Cancellieri, L., Iocchi, M. and Cutini, M., 2017. Old coppice versus high forest: the impact of beech forest management on plant species diversity in central Apennines (Italy). Journal of Plant Ecology, 10(2), pp.271-280.
Skidmore A. K. and Turner B. J. (1992). Map Accuracy Assessment UsingLine Intersect Sampling. Photogrammetric Engineering and RemoteSensing 58:1453-1457.
Ståhl, G., 1998. Transect relascope sampling – A method for the quantification of coarse woody debris. Forest science, 44(1), pp.58-63.
Stenberg, P., Korhonen, L. and Rautiainen, M., 2008. A relascope for measuring canopy cover. Canadian Journal of Forest Research, 38(9), pp.2545-2550.
Strand, L., 1957. Relascopic height and cubic volume determination. Norsk Skogbruk, 3, pp.535-538.
Schreuder, H.T., Banyard, S.G., Brink, G.E., 1987. Comparison of three sampling methods in estimating stand parameters for a tropical forest. Forest Ecol. Manage. 21, 119-127.
Thompson, S. K. 2002. Sampling. New York: Wiley.
Vollmuth, D. 2022. The changing perception of coppice with standards in German forestry literature up to the present day – From a universal solution to a defamed and overcome evil – and back? Trees, forests and people, 10, 100338.
Woldendorp G, Keenan RJ, Barry S, Spencer RD. 2004. Analysis of sampling methods for coarse woody debris. Forest Ecology and Management 198, 133-148. doi:10.1016/j.foreco.2004.03.042.
Appendix

Table A1: One-way ANOVA to test whether there is a significant difference between inventory techniques in the estimation of N.
Tabelle A1: Einfaktorielle ANOVA, um zu testen, ob es einen signifikanten Unterschied zwischen Inventurtechniken bei der Schätzung von N.

Table A2: One-way ANOVA to test whether there is a significant difference between inventory techniques in the estimation of AGB.
Tabelle A2: Einfaktorielle ANOVA, um zu testen, ob es einen signifikanten Unterschied zwischen Inventurtechniken bei der Schätzung von AGB.


