Schlüsselbegriffe: DBH, Formfaktor, Modelle, Shorea robusta, Volumenvorhersage
Abstract
Precise and accurate prediction of tree volume is important to quantify growing stock and to support decision making for sustainable forest management. This study was carried out to estimate the form factor and to develop volume prediction models of Shorea robusta. We selected 48 sample trees from the Western low land of Nepal through purposive sampling. The diameters at 0.3 m, 0.8 m, 1.3 m and 1.8 m above the ground level were measured before felling the trees. After felling the diameters were measured at 2.8 m, 4 m, 6 m above the ground level and continue up to the tip of the tree at the interval of 2 m. We also measured the length of each section between two consecutive diameter measurement point and total height. We estimated breast height and absolute form factors, and calculated the arithmetic mean and variation of the form factors. We developed a model that can predict under bark diameter from over bark diameter and diameter at breast height (DBH) from stump diameter. Similarly, we developed models to predict stem volume using a different combination of predictor variables (DBH and/or height). The breast height form factor was 0.43 and absolute form factor was 0.40. The linear model fitted best to describe the under bark to over bark relation and DBH to stump diameter relation. Simple power function (R2=0.95) best fitted to our volume data. The product of squared DBH and height (R2=0.96) performed as the best predictor for volume prediction. Our form factor and volume model significantly differed with the previously developed form factor and models of Shorea robusta. Thus, we recommend developing site-specific form factors and volume models of Shorea robusta across the country. The models developed in this study are expected to contribute to predicting volume, biomass and carbon and thus contribute to sustainable forest management and may contribute to the calculation of the national carbon budget.
Zusammenfassung
Eine präzise und genaue Schätzung des Stammvolumens ist wichtig für die Berechnung des Bestandszuwachses, um damit die nachhaltige Waldbewirtschaftung zu unterstützen. Diese Studie wurde mit dem Ziel durchgeführt, den Formfaktor abzuschätzen und Modelle zur Berechnung des Holzvolumens von Shorea robusta zu entwickeln. Wir wählten 48 Probebäume aus dem westlichen Tiefland von Nepal durch gezielte Stichproben aus. Die Durchmesser in 0,3 m, 0,8 m, 1,3 m und 1,8 m Höhe über dem Boden wurden am stehenden Baum gemessen. Nach der Fällung wurden die Durchmesser in 2,8 m, 4 m, 6 m über dem Boden und ab 6 m bis zur Spitze des Baumes im Abstand von 2 m gemessen. Bei geschätzter Brusthöhe und absoluten Formfaktoren berechneten wir das arithmetische Mittel und die Variation der Formfaktoren. Wir entwickelten ein Modell, welches den Durchmesser ohne Rinde aus dem Durchmesser mit Rinde und den Brusthöhendurchmesser (DBH) aus dem Stubbendurchmesser vorhersagen kann. In ähnlicher Weise entwickelten wir Modelle zur Vorhersage des Stammvolumens unter Verwendung einer anderen Kombination von Prädiktorvariablen (DBH und/oder Höhe). Der Formfaktor in Brusthöhe betrug 0,43 und der absolute Formfaktor 0,40. Das lineare Modell passte am besten, um das Verhältnis zwischen ohne Rinde und mit Rinde sowie zwischen DBH und Stubbendurchmesser zu beschreiben. Die einfache Potenzfunktion (R2=0,95) passte am besten zu unseren Volumendaten. Das Produkt aus dem Quadrat von DBH und Höhe (R2=0,96) war der beste Prädiktor für die Volumenvorhersage. Unser Formfaktor- und Volumenmodell unterschied sich signifikant von den zuvor entwickelten Formfaktor- und Volumenmodellen von Shorea robusta. Daher empfehlen wir die Entwicklung von standortspezifischen Formfaktoren und Volumenmodellen für Shorea robusta im ganzen Land. Es wird erwartet, dass die in dieser Studie entwickelten Modelle zur Vorhersage von Volumen, Biomasse und Kohlenstoff beitragen und somit einen Beitrag zur nachhaltigen Waldbewirtschaftung und zur Berechnung des nationalen Kohlenstoffbudgets leisten können.
1. Introduction
Forest measurement and inventory crucially assists forest management decisions and provides the information required for current and future forest management planning. The common variables measured in forest inventories are diameter at breast height (DBH), height, crown measures and these variables are used to derive other variables such as form factor, volume, biomass, carbon, productivity, diversity and importance value index (Baral et al., 2020; Bhandari et al., 2021a; Bhandari et al., 2021b). The form factor is an important factor as this converts the volume of the reference cylinder of a tree to the actual volume (Tenzin et al., 2017). DOF (2004) has recommended a constant value of 0.5 as a form factor for all tree species and tree sizes individuals in Nepal. However, the value of form factor varies greatly with size, age, stand density, species, and management regimes of forest (Chaturvedi and Khanna, 2011; Shrestha et al., 2018a; Baral et al., 2020). Using a single form factor for all the species and all sized individual is likely to introduce errors in estimating tree volumes. Thus, estimating form factor for each species in each geographical region is required to estimate the accurate volume of individual trees. Furthermore, form factor also provides important information about the rate of tapering of the stem of a tree which has a fundamental role in estimating the tree volume (Chaturvedi and Khanna, 2011). Deriving volume from DBH and height requires a mathematic relationship of volume with DBH alone or DBH and height. Such mathematical relationships are generally expressed as allometric equations. The allometric equations of volume with DBH and/or height have been used as one of the appropriate means to estimate the volume of an individual tree or the stand. Such prediction of the volume provides useful information in management and silvicultural research (Ozçelik et al., 2010).
Forests cover 44.7% of the total area of Nepal (DFRS, 2015). These forests provide a significant proportion of contribution in the gross domestic product (GDP) (Ranjit, 2011; MOFSC, 2017) and are an integral part of livelihood in rural communities of Nepal (Pandey et al., 2010). These forests not only provide timber, fuelwood, fodder, food and grasses but also provide other ecosystem services, habitat for a large number of wild animals and store carbon dioxide emitted in the atmosphere (DFRS, 2015; Sadaula et al., 2020). Terai region of Nepal consists of 8.4% forests with an average growing stock of 161.7 m3ha-1 and has an important tropical forest that provides habitat for economically valuable tree species including Sal (Shorea robusta, C.F. Gaertn, family Dipterocarpaceae) (DFRS, 2015).
The Sal tree is a large-sized dominant tree species that grows in the tropical forest of Nepal (Jackson, 1994). Shorea robusta grows up to a height of 30 m to 50 m and DBH of 3 m to 3.5 m (Chitale and Behera, 2012). Shorea robusta is distributed across Nepal, India, Bangladesh and Myanmar (Stainton, 1972; Gautam and Devoe, 2006; Awasthi et al., 2015; Awasthi et al., 2020). In Nepal, it is distributed from 120 m to 1200 m elevation but is more common in < 800 m elevation (Sah, 2000; Jackson, 1994). Shorea robusta contributes 19.3% (31.8 m3 ha-1) in total standing volume, an average stem number of 65 stems per ha (dbh ≥ 10 cm) and 15.3% of the forest area in Nepal are covered by Shorea robusta forest (DFRS, 2015). While comparing the species wise contribution, Shorea robusta is in the first rank in total standing volume, density and forest type coverage. Shorea robusta is a multipurpose tree species and has been extensively used as timber, construction material and fuelwood (Jackson, 1994), leaves as fodder (Kibria et al., 1994) and plates (Kora, 2019), resin as medicine of dysentery and gonorrhoea (Joshi, 2003).
Despite the huge importance of Shorea robusta forest in the country, there are limited studies that focus on the measurement and estimation of growth and yield. A few biomass prediction equations of Shorea robusta have been developed by Chapagain et al. (2014) and Bhandari and Chhetri (2020), however, these biomass prediction equations are for small-sized individuals. Sharma and Pukkala (1990) developed volume equation of Shorea robusta using the sample from the whole country and Subedi (2017) developed volume equation of Shorea robusta using the sample from only two districts (Kanchanpur and Kailali) of Sudurpashchim province of Nepal. The volume equation of Sharma and Pukkala (1990) is very old and the equation of Subedi (2017) is restricted to small geographical areas. As the variability in altitude, rainfall, management regimes and disturbance exist in the forest of Shorea robusta across the country, a universal equation may not be able to accurately predict the volume. This emphasized the necessity of site or region-specific volume equations. While developing the volume equation, sub-model that can predict the under bark DBH from over bark DBH facilitates the prediction of under bark volume which is commonly used to estimating the timber volume during timber trade. Sub-model that can predict DBH from the stump diameter is also an important component of total volume prediction for the special cases such as prediction of individual tree volume from the stump that has been felled and removed in the past. These sub-models play an important role in predicting total volume and economic value of trees where the illegal felling of trees occurs.
The overall aim of this study was to determine the form factor and to develop a model that can predict the total stem volume of Shorea robusta. To achieve this aim, we estimated two different types of form factors (breast height form factor, and absolute form factor). To select the best model that can predict the volume of individual trees of Shorea robusta, we fitted different forms of the models and identified the best form of the model. After identifying the best form of the model, we further optimized the model of that form, using a different combination of predictor variables. We also simplified our models to make them more applicable depending on the availability of different predictor variables. The developed models were also compared with the previously developed volume models of Shorea robusta.
2. Materials and Methods
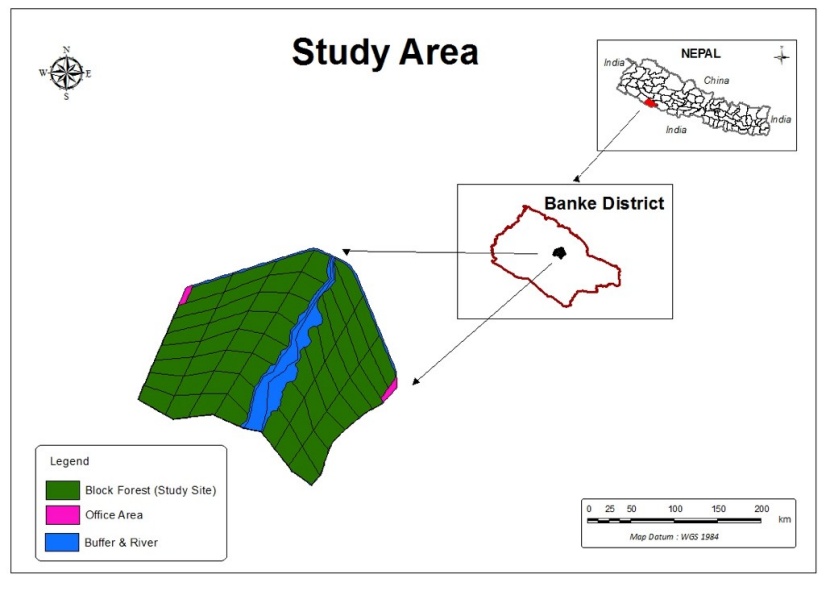
Figure 1: Map of Nepal showing location of study site. / Abbildung 1: Karte von Nepal mit Lage des Untersuchungsgebietes.
2.1 Study area
The study was conducted in Shamshergunj-Mathewas block forest (Area=2578 ha) of Banke district Nepal (27°36’N to 28°29’N and 82°2’E to 82°5’E) (Figure 1). The forest coverage in the district is 50.17% (DFRS 2015) and 48.14% of the total forest area is under Divisional Forest Office, Banke while the remaining forest is under the National Park and Buffer Zone (FMOP, 2017). The altitude of the district ranges from 127 m to 1231 m above mean sea level (FMOP, 2017). The forest is a Shorea robusta dominated forest and consist of other species such as Syzygium cumini, Terminalia chebula, Terminalia belerica, Phyllanthus emblica, Woodfordia fruticose and Aegle marmelos. The average minimum and maximum temperature measured in the nearest weather station are 9.3 °C in January and 34.4 °C in June and average annual rainfall is 1210 mm (DHM, 2017).
2.2 Data collection
Size variation of the individual Shorea robusta tree in the forest was identified from the previous measurements and documents of the forests. We selected 48 sample trees purposively from the whole forest in such a way that the selected sample trees could represent the variation in site quality, stand density, and tree size (Adinugroho and Sidiyasa, 2006; Shrestha et al., 2018b). We physically inspected the potential sample trees to avoid broken top, abnormal stem, dead, dying and diseased (Shrestha et al., 2018b; Bhandari and Chhetri, 2020). This is a quite common approach used in selecting the sample tree in purposive sampling to minimize the error. Since the forest consists of larger size Shorea robusta trees, our sample did not include trees smaller than 30 cm over bark DBH (DBHOB).
Data collection was carried out during February/March 2020. The over bark diameter at 0.3 m, 0.8 m, 1.3 m, and 1.8 m above the ground level were measured using the diameter tape before felling the trees. After felling the trees at 0.3 m above the ground level, the over bark diameter were measured at 2.8 m, 4 m, 6 m, up to the tip of the tree at the interval of 2 m. The under-bark diameter was also measured at each point where the over bark diameter was measured after removing the bark. The total height of felled trees was measured using linear tape and the height of stump was also added to obtain the total height of the sample tree. The sectional method was used for volume calculation of each tree, assuming stump as a cylinder, top portion as cone and all other middle portion as paraboloid. Therefore, we used the cylindrical formula for stump (equation 1), the Smalian formula for the middle portion (equation 2) and the conical formula for the top section (equation 3) of the tree.
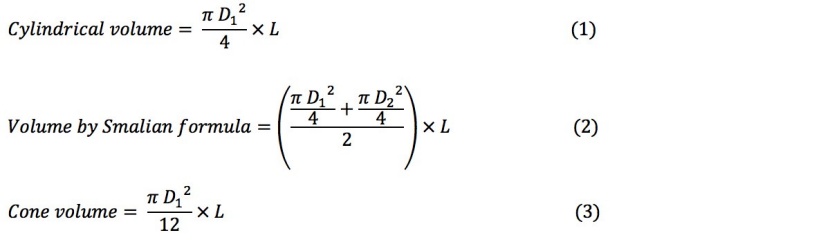
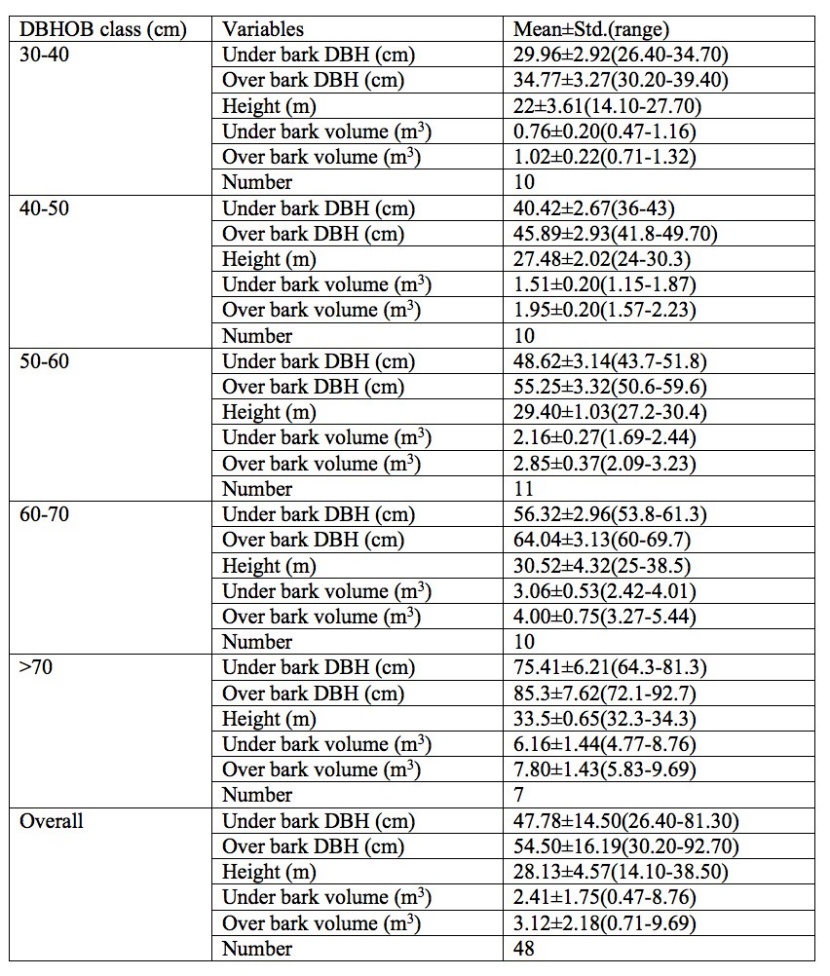
Table 1: Descriptive statistics of variables used for the form factor estimation and volume modelling. / Tabelle 1: Deskriptive Statistik der für die Formfaktorschätzung und Volumenmodellierung verwendeten Variablen.
In equations 1-3, for cylindrical volume D1 is the diameter at thin end, and for Smalian and cone volume, D1 is the diameter at the thick end, D2 is the diameter at the thin end and L is the length of the section.
The total stem volume (over and under bark volume) of each tree was calculated by adding the volume (over and under-bark volume) of each section including the stump and top portion of the tree. The summary of the data used in this study is presented in Table 1.
2.3 Data analysis
2.3.1 Estimation of form factors
We estimated two different types of form factor: (i) Breast height or artificial form factor, (ii) Absolute form factor. Breast height form factor was estimated as the ratio between the actual total stem volume of a tree above the ground level and the product of cross-sectional area at breast height and the total height of the trees (Equation 4) (Chaturvedi and Khanna, 2011). The absolute form factor was estimated as the ratio between the actual total stem volume of a tree and the product of cross-sectional area at any convenient height, and height of the tree above the point of measurement of cross-sectional area (Equation 5) (Chaturvedi and Khanna, 2011). We considered 0.8 m above the ground as a convenient height to calculate the absolute form factor. For both categories of form factors, over-bark and under-bark form factors were calculated.
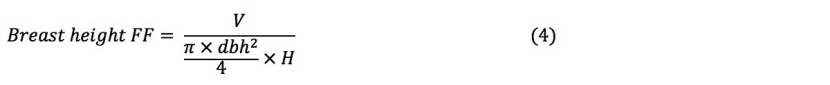
In equation (4), V is the actual stem volume of tree (m3), dbh is the diameter at breast height (m), and H is the total height of tree (m).

In equation (5), V is the actual stem volume of tree (m3), d is the diameter at 0.8 m above the ground level (m), and h is the height of the tree above 0.8 m from the ground level (m).
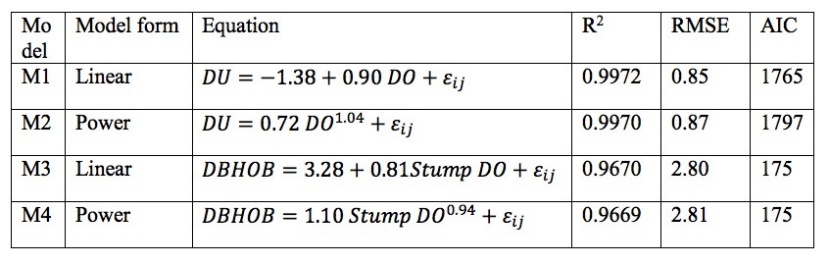
Table 2: Fit statistics (R2, RMSE and AIC) of model for predicting under bark diameter from over bark diameter and DBH from stump diameter (DO is over-bark diameter, DU is under-bark diameter, DBHOB is the diameter at breast height over bark, Stump DO is the stump diameter over bark). / Tabelle 2: Anpassungsstatistiken (R2, RMSE und AIC) des Modells zur Vorhersage des Durchmessers ohne Rinde aus dem Durchmesser mit Rinde und des DBH aus dem Stubbendurchmesser (DO ist der Durchmesser mit Rinde, DU ist der Durchmesser ohne Rinde, DBHOB ist der Durchmesser auf Brusthöhe mit Rinde, Stubben DO ist der Stubbendurchmesser mit Rinde).
2.3.2 Relationship of over bark diameter with under bark diameter and DBHOB with stump diameter
We fitted a linear model and a power model to predict under bark diameter from over bark diameter and DBH from stump diameter (over bark diameter at 30 cm above the ground) (Table 2). All diameter measurements along the stem were used to model the relationship between the over-bark and under-bark diameter.
2.3.3 Volume modelling
We fitted different forms of models including linear, logarithmic, inverse, quadratic, power, sigmoid and exponential (Table 3) to our data to select the best under bark volume prediction model. For volume prediction, we fitted the models with under bark volume as the dependent variable and under bark diameter as the predictor variable. The parameters and fit statistics for each model were estimated in R-platform using the lm, nls and nlsLM function in the minpack.lm package (R Core Team, 2017), and evaluated using different criteria including the significance of estimated parameters (at 5% level of significance); coefficient of determination (R2); root mean squared error (RMSE) (Montgomery et al., 2001); and Akaike Information Criterion (AIC) (Akaike, 1972). We also analysed the distribution of residuals against the predicted value in selecting the best model.
Once the best form of volume equation was selected, different combinations of predictor variables were used in that form of volume equation by following the methods of Bhandari and Chhetri (2020). The different combinations of predictor variables used were DBH alone, the product of DBH and height, the product of the squared DBH and height. We developed two categories of volume models; (i) model based on DBH only and, (ii) model based on both DBH and height. For each category, we also developed the separate models to predict under bark volume from; (i) under bark DBH and, (ii) over bark DBH. We also developed a model to predict over bark volume from over bark DBH.
2.3.4 Comparison of volume models with previously developed models
The volume models developed in this study were also compared with previously developed stem volume models of Shorea robusta in Nepal. Sharma and Pukkala (1990) (Equation 6) and Subedi (2017) (Equation 7) had developed stem volume models for Shorea robusta in Nepal.
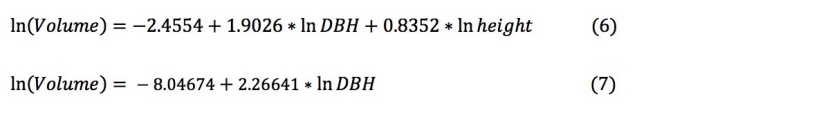
Where ln is natural logarithm and DBH is diameter at breast height (cm).
For comparison, we predicted the volume using the models of Sharma and Pukkala (1990), and Subedi (2017) and the models developed in this study. After predicting the volume from each model, we plotted the predicted volume against over bark DBH. To test whether the volume predicted by the model of this study and previously developed models differ significantly, we used paired sample t-test at a 95% confidence interval.
3. Results
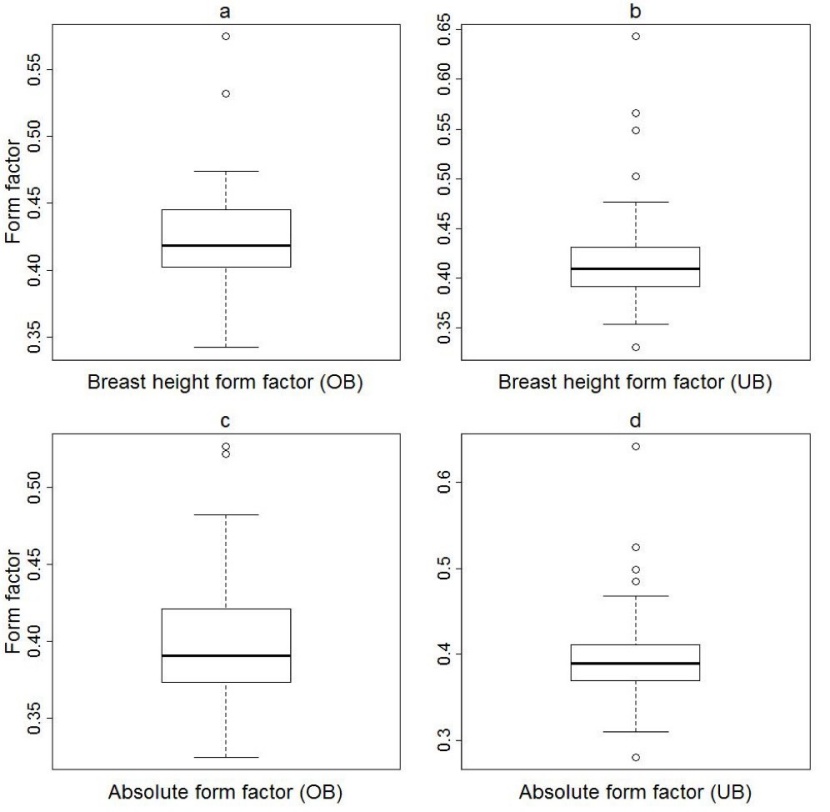
Figure 2: Variation of over bark absolute form factor and under bark absolute form factor. The box and whisker plots shows 25%, 75% quartile and median. / Abbildung 2: Variation des absoluten Formfaktors ohne Rinde und des absoluten Formfaktors mit Rinde. Die Box- und Whisker-Plots zeigen auch 25%, 75% Quartil und Median an.
3.1 Form factor
The variation in breast height form factor and the absolute form factor is presented in Figure 2. The median value of both breast height form factor and absolute form factor was higher for over bark form factor compared to under bark form factor. The over bark breast height form factor of Shorea robusta varied from 0.34 to 0.57 with an average value of 0.43, whereas under bark breast height form factor of Shorea robusta varied from 0.32 to 0.64 with an average value of 0.42. The over bark absolute form factor of Shorea robusta varied from 0.32 to 0.52 with an average value of 0.40, whereas under bark absolute form factor of Shorea robusta varied from 0.28 to 0.64 with an average value of 0.40).
3.2 Relationship of over bark diameter with under bark diameter and DBHOB with stump diameter
The linear model (M1) produced 0.02% more R2, 2.29% less RMSE and 1.78% less AIC than the power model (M2) in predicting the under-bark diameter from the over-bark diameter. Similarly, the linear model (M3) produced 0.01% more R2, 0.35% less RMSE and no improvement in AIC than the power model (M4) in predicting DBHOB from over-bark stump diameter. Therefore, we selected the linear model (M1) to predict under-bark diameter from the over-bark diameter and linear model (M3) to predict the DBHOB from over bark stump diameter (Table 2).
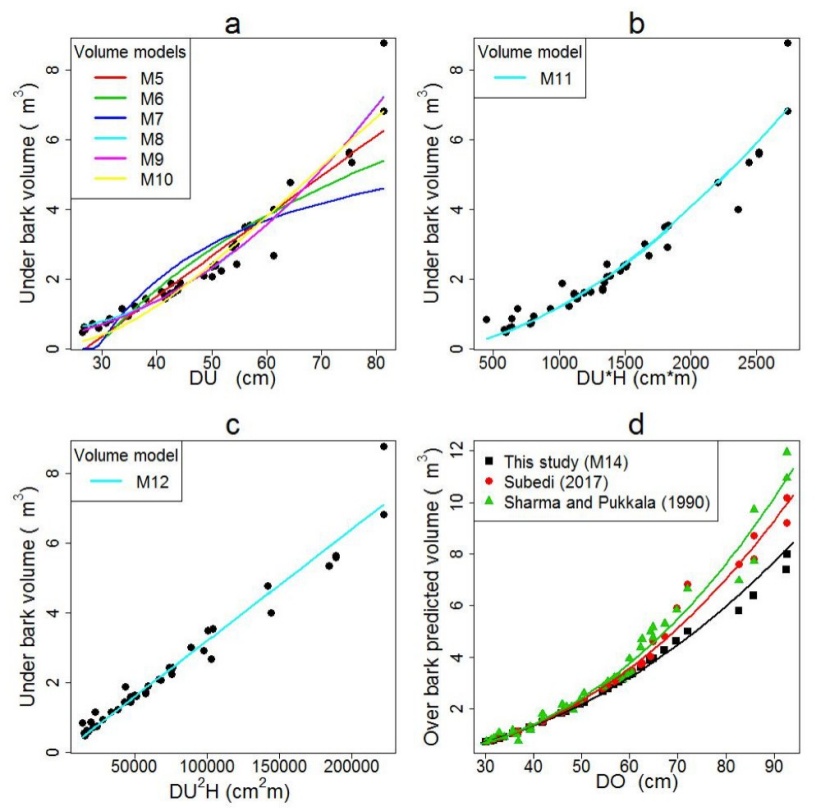
Figure 3: Different volume models and the observations (panel a); volume models based on the product of under bark diameter and height only (b); volume models based on the product of square of under bark diameter and height only (c); comparison of volume models developed in this study with the previous models (d). / Abbildung 3: Verschiedene Volumenmodelle und die Beobachtungen (Panel a); Volumenmodelle, die nur auf dem Produkt aus dem Durchmesser ohne Rinde und der Höhe basieren (b); Volumenmodelle, die nur auf dem Produkt aus dem Quadrat des Durchmessers ohne Rinde und der Höhe basieren (c); Vergleich der in dieser Studie entwickelten Volumenmodelle mit den bisherigen Modellen (d).
3.3 Volume modelling
All the models, we fitted to predict volume, produced significant parameters at a 95% confidence interval. The inverse form of the model (M7) only described 67% of the variation in total stem volume with highest RMSE and AIC than other models (Table 3). The logarithmic form of the model (M6) only described 80% of the variation in total stem volume and with 0.76 RMSE and 111 AIC. The remaining four models described more than 90% variation in total stem volume. The residuals plotted against the predicted under bark volume showed that the power form of the model (M9) had minimum residuals compared to other models (Figure 4). The quadratic (M8) and power (M9) form of the model described more than 95% variation in total stem volume with a minimum residual of 0.36. The AIC of the power form of the model (43) was smaller than the AIC of the quadratic form of the model (45), therefore we selected the power form of the model for prediction of stem volume of Shorea robusta.
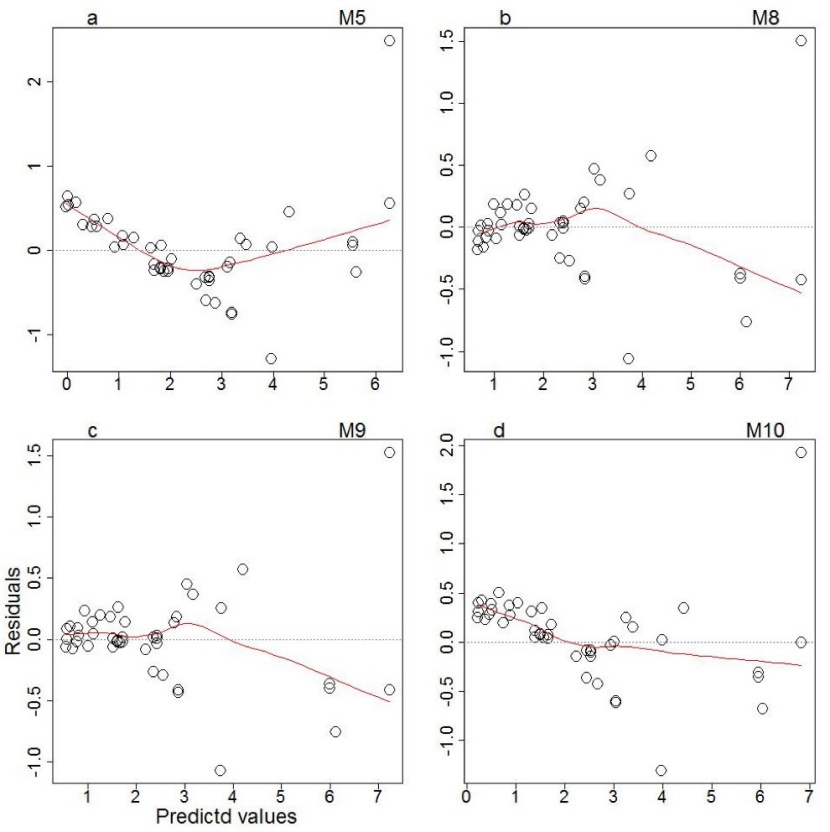
Figure 4: Distribution of residuals for four best performing volume models. / Abbildung 4: Verteilung der Restmengen für die vier leistungsstärksten Volumenmodelle.
The best-selected form of the model (power form; M9) was also further examined by including a different combination of predictor variables to optimize the predictive capacity of the model (Table 4). The estimated parameters for three different categories of the power model were significant. The addition of height in the model did not improve the model, however, the addition of height with the square of under bark diameter improved the fit statistics by 1.05% in R2, 9.09% in RMSE and 18.44% in AIC. The model M9 can be used to predict the volume when only DBH is available and model M12 can be used to predict volume when both DBH and height is available.
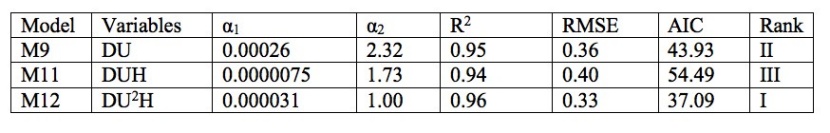
Table 4: Variables and the estimated values of the parameters used for volume prediction models of Shorea robusta in power form with their respective R2, RMSE and AIC (DU is under bark DBH, H is total height). / Tabelle 4: Variablen und die geschätzten Werte der verwendeten Parameter für die Volumenvorhersagemodelle von Shorea robusta in Potenzform mit ihrem jeweiligen R2, RMSE und AIC (DU der DBH ohne Rinde, H ist die Gesamthöhe).
We further made our models more applicable depending on the availability of predictor variables (Table 5). Model M9 can be used to predict under bark volume using under bark DBH. Model M13 can be used to predict under bark volume using over bark DBH. Model M14 can be used to predict over bark volume using over bark DBH. Model M15 can be used to predict under bark volume using the square of under bark DBH and height. Model M16 can be used to predict under bark volume using the square of over bark DBH and height. Similarly, model M17 can be used to predict over bark volume using the square of over bark DBH and height.
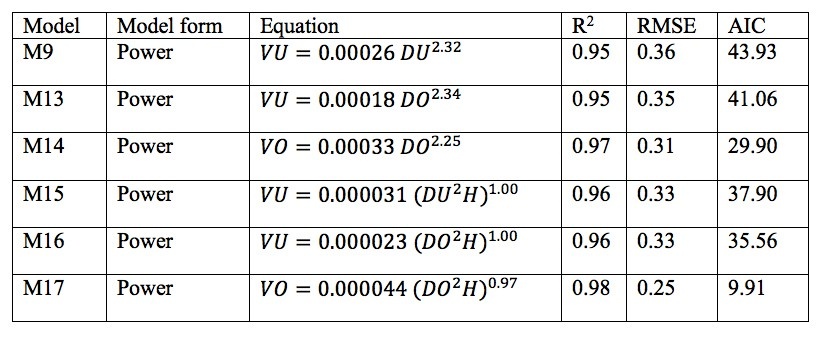
Table 5: Power form of the model to predict over bark and under bark volume depending on the availability of different predictor variables of Shorea robusta. / Tabelle 5: Leistungsfähigkeit des Modells zur Schätzung des Volumens mit Rinde und ohne Rinde in Abhängigkeit von der Verfügbarkeit verschiedener Prädiktorvariablen von Shorea robusta.
3.4 Comparison of models with previously developed volume models
The predicted volume by the model of this study (M14) was significantly different (p<0.05) with the predicted volume of each of the previous models of Subedi (2017) and Sharma and Pukkala (1990). All these three models predicted almost the equal volume for the trees with smaller DBHOB, however, the difference increased with an increase in DBHOB (Figure 3d).
4. Discussion
This study found an average value of over bark breast height form factor 0.43 which is 14% lower than the average value of 0.50 recommended by the Department of the forest, Government of Nepal, for all species across the country (DOF 2004). In a study carried out to estimate the form factor of Shorea robusta from the Bara district of central Terai, Nepal, Baral et al. (2020) reported the over bark average breast height form factor 0.33 and under bark average breast height form factor 0.27. This has prevailed that the form factor recommended by the government of Nepal overestimate the standing volume of the individual trees while the form factor recommended by Baral et al. (2020) underestimates the standing volume of the individual trees. Shrestha et al. (2018a) reported the form factor up to 10 cm top diameter of Shorea robusta 0.51 to 0.65, Dalbergia sissoo 0.50 to 0.56 and Terminalia alata 0.52 to 0.66. Similarly, Thakur (2006) estimated the form factor for Shorea robusta, Schima wallichii, Castanopsis indica, Pinus roxburghii in middle hill district (Parbat district) of Nepal. He found form factor of Shorea robusta 0.58, Schima wallichii 0.57, Castanopsis indica 0.58 and Pinus roxburghii 0.63. Adekunle et al. (2013) estimated form factor of major tree species of Katarniaghat Wildlife Sanctuary which ranged between 0.42 to 0.57. Thakur (2006) reported that the form factor at the pole stage was higher than form factor at sapling or mature stage. Baral et al. (2020) also reported that the form factor of Shorea robusta was higher for medium-sized trees compared to smaller and larger-sized trees. It also revealed another fact that form factor varied not only with species and geographical region, but also with the age of the individual trees. Stand density (number of trees ha-1 or basal area ha-1) plays an important role in the growth of DBH and height of individual trees (Bhandari et al., 2021b). The individual tree that grows in low stand density prioritizes more for diameter growth while the individual tree that grows in high stand density prioritizes more for height growth. This results in individual trees with a shorter heights and larger diameters (low height-diameter ratio) in low-density stands, and taller heights and smaller diameters (high height-diameter ratio) in high-density stands. These varying levels of stand density effects on individual tree growth also influences the stem form of trees.
Our study showed a linear relationship between under bark and over bark diameter and between DBH and stump diameter. In a growth analysis of Pinus roxburghii, Gyawali et al. (2015) reported that the linear function performed best to describe over bark and under bark diameter relationship. In a growth modelling study of Shorea robusta, Sapkota and Meilby (2009) found a simple power model best described the relationship between over bark and under bark diameter and between DBH and stump diameter. The relationship between over bark and under bark diameter is applicable in predicting under bark diameter, under bark basal area, under bark volume from the over bark measurement.
Results from this study revealed the simple power form of the volume models performed best in predicting the individual tree volume compared to other forms of the models. This result is in agreement with several other studies which also showed the simple power function as the best model form in predicting either volume or biomass of individual trees (Sharma et al., 2017; Shrestha et al., 2018b; BK et al., 2019; Bhandari and Chhetri, 2020). It is a well-established fact that the volume, biomass or its growth generally follows a non-linear pattern, however, the form of the non-linear model might be different with species, geographical region and stand density (Huxley and Teissier, 1936; Chave et al., 2005; Chapagain et al., 2014).
Diameter at breast height and the total height of the individual trees are the commonly used predictor variables along with wood density, crown measures, stand density and some other measures of competition. However, using DBH only is one of the most common practice because the measurement of DBH is easier, accurate and cost-effective compared to height and other variables. Our study showed that DBH alone can describe more than 95% variation in stem volume of Shorea robusta. Addition of height together with DBH as predictor variable improved the model predictability (1.05% increase in R2, 8.33% decrease in RMSE and 15.57% decrease in AIC) (Table 5, model M12). Models with DBH only as predictor variable can also be used with acceptable accuracy in the absence of height data. Other studies have reported DBH alone (Nurudeen et al., 2014; Subedi, 2017; Shrestha et al., 2018a), DBH and height (Sharma and Pukkala, 1990; Mugasha et al., 2016) and DBH, height and other predictors (Nurudeen et al., 2014) for predicting the individual tree volume depending on the availability of predictor variables.
We have developed different volume equations to facilitate the prediction of volume depending on the availability of predictor variables. The volume models developed in this study can be used to predict both over bark volume and under bark volume from both over bark DBH and/or under bark DBH. Volume can also be predicted if only DBH data is available or both DBH and height data are available. Our models also facilitate the prediction of under bark DBH from over bark DBH. The allometric relationship between stump diameter and DBH is applicable to predict the DBH and volume of individual trees which were already felled in the forest and the only stump is available. This model might contribute to estimating the timber volume of individual trees which might have been illegally felled and removed from the forest.
As the models developed in this study are based on data from a forest of Banke District, these models may not be able to predict the accurate volume of individual trees of other geographical regions. We observed that the predicted volume of our model differed significantly with those of the earlier model of Sharma and Pukkala (1990) and Subedi (2017). The models of Sharma and Pukkala (1990) was developed using the data collected from across Nepal and the model of Subedi (2017) was developed using the data collected from the two districts (Kanchanpur and Kailali) of the far western part of Nepal. The number of sampled trees used in the model of Sharma and Pukkala (1990) was 895 and in the model of Subedi (2017) was 81 however the number of individual trees used in the present study was only 48. The size of the individual trees used in the models of Sharma and Pukkala (1990) ranged between 12.70 cm to 144.50 cm in DBH and that of Subedi (2017) ranged between 30.10 cm and 108.50 cm in DBH. The DBH range of individual trees used in the present study was relatively smaller (30.20 to 92.7 cm in DBH) than that of Sharma and Pukkala (1990) and Subedi (2017). Besides these, variation in the climate (rainfall and temperature), stand density (basal area and/or number of trees per unit area), management regimes and human disturbance might have played a significant role in the Shorea robusta forest used in these three studies. This demonstrates that the models developed from one geographical region may not be able to predict the volume accurately in another geographical region even for the same species. Therefore, the development of volume prediction models for each region or at least for each state of Nepal is recommended. Alternately, a parameter describing the regional variation in tree shape may be included in the volume equation.
The form factors and volume models developed in this study have potentials to contribute to predicting volume, biomass and carbon for the individual trees of Shorea robusta. As these volume models facilitate the prediction of volume/biomass/carbon from the Shorea robusta forests, this will contribute to the calculation of national carbon budgets of Nepal. Precise prediction and estimation of products from a forest always facilitate in making appropriate decisions in forest management. Indirectly, the model developed in this study will contribute to minimizing the climate change effect through the sustainable management of forest. The sustainable management of forest is not only associated with carbon sequestration and greenery but also associated with livelihood improvement of local people. The modelling approach used in this study might be useful for the development of volume prediction model for other species from the same region or species from other geographical regions. Model validation is one of the important steps in the formulation of the model, however, we could not validate our models because of the lack of independent data sets. Validation of these models with independent data sets is recommended in future to test whether these models can be generalized in other parts of the country.
5. Conclusion
We estimated two types of form factor (breast height form factor and absolute form factor) for Shorea robusta from the western low land of Nepal. The average breast height form factor was 0.43 and 0.42 for over bark and under bark respectively while the average absolute form factor was 0.40 for both over bark and under the bark. The linear model fitted best to describe the under bark to over bark relation and DBH to stump diameter relation. Simple power function best fitted to our volume model. Product of DBH squared and height performed as the best predictor (R2=0.96). This study showed a lower value of form factor than the form factor prescribed by the Department of Forest, Government of Nepal. The estimated form factor and developed volume models in this study are significantly different from the previous studies. Thus, we recommend estimating separate form factor and develop the different site and size-specific volume models across the country. The models developed in this study are expected to contribute to predicting volume, biomass and carbon amount and thus contribute to the calculation of national carbon budget.
Conflict of interest
The authors declare that they have no conflict of interest.
Author contributions
The concept of this study was designed by Mr. Thakur Subedi and Mr. Dipak Mahatara. Data were by collected by Mr. Thakur Subedi, Mr. Dipak Mahatara and Mr. Nabin Pandey. Mr. Shes Kanta Bhandari and Mr. Yajna Prasad Timilsina analysed the data and developed the models. Mr. Shes Kanta Bhandari prepared the draft manuscript. All authors have read thoroughly and agreed to the submitted version of the manuscript.
Acknowledgements
We sincerely thank to the former Director General of Forest Research Training Center (FRTC), Mr. Meghnath Kafle and Director General of FRTC Mr. Yam Prasad Pokharel for their continuous feedback. This work was a part of annual program of FRTC, Nepal and some additional data were also collected on author’s interest. We also thank to the Division Forest Office, Banke, Mr. Anoj Subedi and Mr. Naresh Khanal for the assistance during data collection phase. We also would like to thank Robert Mahara and Theresia Ebert for their assistance in translating the title of the manuscript, figures and tables, and abstract into German language. We also extend thanks to two anonymous reviewers for their constructive comments to earlier version of the manuscript.
References
Adekunle, V.A.J., Nair, K.N., Srivastava, A.K., Singh, N.K. 2013. Models and form factors for stand volume estimation in natural forest ecosystems: a case study of Katarniaghat Wildlife Sanctuary (KGWS), Bahraich District, India. Journal of Forestry Research 24(2):217-226. DOI 10.1007/s11676-013-0347-8.
Adinugroho, W.C.D., Sidiyasa, K. 2006. Biomass estimation model of above-ground mahogany (Swietenia macrophylla) tree. Jurnal Penelitian Hutan dan Konservasi Alam 3(1):103-117.
Akaike, H. 1972. A new look at statistical model identification. IEEE Trans Automatic
Control Ac-19(6):716-723.
Awasthi, N., Bhandari, S.K., Khanal, Y. 2015. Does scientific forest management promote plant species diversity and regeneration in Sal (Shorea robusta) forest? A case study from Lumbini Collaborative forest, Rupandehi, Nepal. Banko Jankari 25(1):20-29.
Awasthi, N., Aryal, K., Chhetri, B.B.K., Bhandari, S.K., Khanal, Y., Gotame, P., Baral, K. 2015. Reflecting on species diversity and regeneration dynamics of scientific forest management practices in Nepal. Forest Ecology and Management 474, 118378.
Baral, S., Neumann, M., Basnyat, B., Gauli, K., Gautam, S., Bhandari, S.K., Vacik, H. 2020. Form factors of an economically valuable Sal tree (Shorea robusta) of Nepal. Forests 11, 754; doi:10.3390/f11070754.
Bhandari, S.K., Maraseni, T., Timilsina, Y.P., Parajuli, R. 2021a. Species composition, diversity, and carbon stock in trees outside forests in middle hills of Nepal. Forest Policy and Economics 125, 102402. https://doi.org/10.1016/j.forpol.2021.102402.
Bhandari, S.K., Veneklaas, E.J., Lachie, M., Mazanec, R., Whitford, K., Renton, M. 2021b. Effect of thinning and fertilizer on growth and allometry of Eucalyptus marginata. Forest Ecology and Management 479, 118594. https://doi.org/10.1016/j.foreco.2020.118594.
Bhandari, S.K., Chhetri, B.B.K. 2020. Individual-based modelling for predicting height and biomass of juveniles of Shorea robusta. Austrian Journal of Forest Science 2:133-160.
BK, R.B., Sharma, R.P., Bhandari, S.K. 2019. A generalized aboveground biomass model for juvenile individuals of Rhododendron arboreum (SM.) in Nepal. CERNE 25(2):119-130.
Chapagain, T., Sharma, R.P., Bhandari, S.K. 2014. Modelling above-ground biomass for three tropical tree species at their juvenile stage. Forest Science and Technology 10(2):51-60.
Chaturvedi, A.N., Khanna, L.S. 2011. Forest mensuration and biometry. Khanna Bandhu, Dehradun.
Chave, J., Andalo, C., Brown, S., Cairns, M.A., Chambers, J.Q., Eamus, D., Folster, H., Fromard, F., Higuchi, N., Kira, T., Lescure, J-P., Nelson, B.W., Ogawa, H., Puig, H., Riera, B., Yamakura, T. 2005. Tree allometry and improved estimation of carbon stocks and balance in tropical forests. Oecologia 145(1):87-99.
Chitale, V.S., Behera, M.D. 2012. Can the distribution of sal (Shorea robusta Gaertn. f.)
shift in the north-eastern direction in India due to changing climate? Current Science 102(8):1126-1135.
DFRS. 2015. State of Nepal's Forests. Forest Resource Assessment (FRA) Nepal, Department of Forest Research and Survey (DFRS). Kathmandu, Nepal.
DOF. (2004). Community Forest Inventory Guideline; Ministry of Forests and Soil Conservation, Department of Forest (DOF): Kathmandu, Nepal.
DHM. 2017. Observed climate trend analysis in the districts and physiographic regions of Nepal (1971-2014). Department of Hydrology and Meteorology, Kathmandu.
Forest Management Operational Plan. 2017. Shamshergunj-Mathewas block forest, Shamshergunj, Banke.
Gautam, K.H., Devoe, N.N. 2006. Ecological and anthropogenic niches of sal (Shorea robusta Gaertn. f.) forest and prospects for multiple-product forest management-a review. Forestry: An International Journal of Forest Research 79(1):81-101. https://doi.org/10.1093/forestry/cpi063.
Gyawali, A., Sharma, R.P., Bhandari, S.K. 2015. Individual tree basal area growth models for Chir pine (Pinus roxberghii Sarg.) in western Nepal. Journal of forest science, 61(12):535-543.
Huxley, J.S., Teissier, G. 1936. Terminology of relative growth. Nature 137:780–781.
Jackson, J.K. 1994. Manual of afforestation in Nepal. Forest research and survey centre, Kathmandu, Nepal. P 824.
Joshi, K. 2003. Leaf flavonoid patterns and ethnobotany of Shorea robusta Gaertn. (Dipterocarpaceae). Proceedings of International Conference on Women, Science & Technology for Poverty Alleviation (Pp. 101-107). WIST, Kathmandu, Nepal.
Kibria, S.S., Nahar, T.N., Mia, M.N. 1994. Tree leaves as alternative feed resource for Black Bengal goats under stall-fed conditions. Small Ruminant Research 13:217-222.
Kora, A.J. 2019. Leaves as dining plates, food wraps and food packing material: importance of renewable resources in Indian culture. Bulletin of the National Research Centre 43. https://doi.org/10.1186/s42269-019-0231-6.
MOFSC. 2017. Forest investment program, investment plan for Nepal, investing in forest for prosperity at a time of transformation, Ministry of Forest and Soil Conservation, Government of Nepal. 145p.
Montgomery, D.C., Peck, E.A., Vining, G.G. 2001. Introduction to linear regression analysis. Wiley, New York, USA. P 641.
Mugasha, W.A., Mwakalukwa, E.E., Luoga, E., Malimbwi, R.E., Zahabu, E., Silayo, D.S., Sola, D., Crete, P., Henry, M., Kashindye, A. 2016. Allometric models for estimating tree volume and aboveground biomass in lowland forests of Tanzania. International Journal of Forestry Research 8076271, 13. http://dx.doi.org/10.1155/2016/8076271
Nurudeen, T.A., Abiola, J.K., Salami, K.D., Erinle, O.A., Olaniyi, W.A. 2014. Regression models for tree volume prediction in stands of Tectona grandis (Linn) at Federal College of Forestry, Jericho, Ibadan, Oyo State Nigeria. Science Journal of Agricultural Research and Management. doi:10.7237/sjarm/233.
Ozçelik, R., Diamantopoulou, M.J., Brooks, J.R., Wiant, Jr. H.V. 2010. Estimating tree bole volume using artificial neural network models for four species in Turkey. Journal of Environmental Management 91(3):742-753.
Pandey, S.S., Subedi, B.P., Dhungana, H. 2010. Economic potential of forest resources of Nepal. Banko Jankari 20(2):48-52.
Ranjit, Y. 2011. Economic impact of people’s participation in forest management (a case study of Kabhre Planchow, Nepal). Economic Journal of Development Issues 13-14(1-2):139-151.
R Core Team. 2017. R: A Language and Environment for Statistical Computing.
Sadaula, A., Pandeya, Y.R., Shah, Y., Pant, D.K., Kadariya, R. 2020. Wildlife population monitoring study among endangered animals at protected areas in Nepal. In: Ferretti M (ed) Wildlife Population Monitoring. DOI: 10.5772/intechopen.84365.
Sah, S.P. 2000. Management options for sal forests (Shorea robusta Gaertn.) in the Nepal Terai. Selbyana 21:112-117.
Sapkota, P., Meilby, H. 2009. Modelling the growth of Shorea robusta using growth ring measurements. Banko Jankari 19(2):25-32.
Sharma, E.R., Pukkala, T. 1990. Volume and biomass prediction equations of forest trees of Nepal. Forest survey and statistical division, Ministry of forest and soil conservation, Kathmandu, Nepal.
Sharma, R.P., Bhandari, S.K., BK, R.B. 2017. Allometric bark biomass model for Daphne bholua in mid-hill of Nepal. Mountain Research and Development 37(2):206-215.
Shrestha, D.B., Sharma, R.P., Bhandari, S.K. 2018b. Individual tree aboveground biomass for Castanopsis indica in the mid-hills of Nepal. Agroforestry Systems 92(6):1611-1623. doi: 10.1007/s10457-017-0109-2.
Shrestha, H.L., Kafle, M.R., Khanal, K., Mandal, R.A., Khanal, K. 2018a. Developing local volume tables for three important tree species in Nawalparasi and Kapilvastu districts. Banko Janakari 27:84-91.
Stainton, J.D.A. 1972. Forests of Nepal. John Murray, London. 181p.
Subedi, T. 2017. Volume models for Sal (Shorea robusta Gaertn.) in far-western Terai of Nepal. Banko Jankari 27(2):3-11.
Tenzin, J., Wangchuk, T., Hasenauer, H. 2017. Form factor functions for nine commercial tree species in Bhutan. Forestry 90:359-366.
Thakur, R.B. 2006. Determination of form factor of major tree species of Parbat District (Sal, Chilaune, Katus, Salla & miscellaneous Species); Livelihoods & Forestry Program: Parbat, Nepal.


