Schlüsselbegriffe: Brennmaterial, Holzfeuchte, Waldbrand, Nadelwald, Brand- gefahr
Abstract
The moisture of fine dead fuels in the understory is an important factor for forest fire ignition and fire propagation. Temperature and relative humidity have a direct impact on fuel moisture and are known to be influenced by solar radiation, rainfall, and wind speed, all of which vary according to vegetation characteristics. Fuel moisture sticks offer an efficient method for estimating the moisture of natural fuels. The objectives of this study are to compare fuel stick moisture content among various forest cover types and to compare the variation of the moisture content among 3 fuel-stick sizes representing 1-hour, 10-hour, and 100-hour moisture time lags across multiple seasons within 2 consecutive years. The moisture content (MC) of the fuel sticks differed between cover types and among stick sizes, between seasons within the annual cycle, and MC was negatively correlated with calculated Fine Fuel Moisture Code (FFMC) values. The recorded fuel moisture was negatively correlated with canopy openness as measured by sky fraction in the sampled plots, indicating that moisture values are expected to depend on local micro-climatic conditions.
Zusammenfassung
Der Feuchtegehalt von totem Brennmaterial in der Unterschicht von Waldbeständen ist ein entscheidender Faktor für die Entzündungsgefahr und Ausbreitungsgeschwindigkeit von Waldbränden. Temperatur und relative Luftfeuchtigkeit haben einen direkten Einfluss auf die Holzfeuchte, welche durch die Sonnenstrahlung, Niederschlag und Wind in Abhängigkeit der Vegetationszusammensetzung beeinflusst werden kann. Das Ziel dieser Studie liegt daher im Vergleich des Holzfeuchtegehalts von drei Kategorien von Brennmaterialien für Waldbestände mit unterschiedlichem Kronenschluss für zwei aufeinanderfolgende Jahre an Beobachtungen. Die Ergebnisse zeigen, dass der Holzfeuchtegehalt abhängig ist von der Größenklasse der Brennmaterialien, dem Kronenschluss der Bestände und dem Beobachtungszeitraum innerhalb der Saison. Der Holzfeuchtegehalt ist negativ korreliert mit den ermittelten FFMC Werten und dem Kronenschlussgrad. Es konnte gezeigt werden, dass der Holzfeuchtegehalt stark von den mikro-klimatischen Bedingungen in der Waldbeständen abhängt.
1. Introduction
The characteristics of fine surface fuels, such as load, arrangement and moisture content, are important factors for fire ignition and propagation (Rothermel 1972). Fuel moisture is a key predictor of fire behavior (Xanthopoulos & Ronald 1993, Bianchi & Defosse 2014). Fuel moisture is determined by several factors including forest structure, fuel type, current and past weather conditions, climate and topography (Matthews 2014). Temperature and relative humidity within the forest stand have a direct impact on fuel moisture and are known to be influenced by solar radiation, rainfall and wind speed, which varies under different forest types (Whitehead et al. 2006). As large quantities of precipitation can be stored in the litter, the solar radiation as a source of energy has an important role in heating and drying fuels (Matthews 2014). Single-layered dense forests have a higher canopy interception, and less direct sunlight can reach the forest floor. Open forests will have a higher amount of throughflow and radiation penetrating to the ground, which will influence the fuel moisture accordingly. Forest structure will, however, affect fuel moisture and potential fire behavior nonlinearly, and therefore will cause different fuel moisture levels with a varying canopy closure, vertical structure or tree density at given environmental conditions. Furthermore, ignition potential might be lower in open-canopy forests during lightning events that are accompanied by rain (Estes et al. 2012). Whitehead (2006) and Estes et al. (2012) have found that weather conditions and woody fuel moisture differed between thinned and unthinned coniferous forest stands. While thinning of mature forest stands is often recommended to reduce crown bulk density and lower the likelihood of severe crown fires (Hirsch and Pengelly 1999), thinning may also affect fine fuel moisture content and the within-stand microclimate (Scott & Reinhardt 2001). Additionally, the fuel characteristics (e.g. amount of leafs versus needles in the humus layer) play a decisive role in moisture content (Viney 1991). Therefore, the response of fine fuel moisture to changes in humidity depends on not only the forest structure but also on the tree species mixture/composition and the fuel bed characteristics.
In European mountain forests coniferous tree species dominate, which often causes single-layered stand structures with a dense litter layer subjected to harsh environmental conditions. Less than half of the land in Austria is covered by mountain forests, and 74.8% of the forests are dominated by Norway spruce (Picea abies), European larch (Larix decidua) and Pine (Pinus sylvestris, Pinus nigra) (AFI 2012), which make them an interesting study system for fuel studies. The mountain forests in Austria have not been seriously fire-impacted in the past. However, several summer seasons (2003, 2007) have most recently demonstrated how widespread and rapidly forest fires can happen (Vacik et al. 2011). They might become an important issue in the case of the occurrence of certain weather extremes such as long period of drought or strong heat waves (Müller et al. 2015). It is therefore likely that under climate change the fire danger will increase within Austrian mountain forests (Arpaci et al. 2014). In this context it becomes even more important to provide a sound empirical basis for estimating fire danger based on fuel moisture conditions.
Knowledge about fuel moisture under varying environmental conditions and forest structures is important for the design of accurate fire prediction models. However, empirical fuel moisture data for these models have been collected in fuel experiments mostly in Canada or the United States. Whitehead (2006) has shown that moisture content of lodgepole pine needle litter corresponded well with the Canadian Fire Weather Index System, but further work is needed to examine physical models of fuel moisture and microclimate under a wider range of stand densities, fuel types and climatic conditions. Also Wotton and Beverly (2007) recommend to sample empirical data on fuel moisture for a given forest type in order to improve the quality of predictions in fire ignition when applied to new regions with different conditions. In this context an empirical basis about fuel conditions in Austrian forests for fire prediction modelling is lacking.
The empirical measurement of fine fuel moisture content using standardized fuel sticks is commonly used to reflect the relationship between natural fuel and the environment in estimating fire danger (Carlson et al. 2007). There are several methods to assess fuel moisture conditions under varying forest structures, such as direct measures (gravimetric measurement following manual measuring of fuel material or standardized fuel sticks) or capacitive sensor techniques (automatic measurement of standardized fuel sticks). Several studies have shown the applicability, the precision, reliability and long term performance of these methods and their limits, whereas only few studies were conducted in Europe (e.g. Harrington 1983, Hartford & Rothermel 1991, Nelson 2000). Studies focusing on non-direct measures of fuel moisture conditions were conducted in European Mediterranean ecosystems (Viegas et al. 1992) or alpine forests (Zumbrunnen et al. 2012, Schunk et al. 2014).
Our aim is to examine the relationship between varying environmental conditions and fuel stick moisture. The specific objectives of this study are (i) to relate the measured fuel stick moisture to the calculated fine fuel moisture code (FFMC), (ii) to explore the effect of different forest structures on fuel stick moisture content and (iii) to compare the moisture content of three different fuel stick sizes under different environmental conditions. Based on the identified effects of multiple distinct forest structures on fuel moisture, we draw conclusions on the gravimetric measurement of fuel sticks and the use of fire weather indices for providing fire danger rating.
2. Material and Methods

Figure 1: Map of the study area in the nursery and experimental forest “Knödelhütte” (grey dots indicate the location of the sampling plots) / Abbildung 1: Karte der untersuchten Waldbestände im forstlichen Versuchsgarten und Baumschule Knödelhütte (graue Punkte zeigen die Versuchsanlagen)
2.1 Study area and plot characteristics
The study was conducted in the nursery and experimental forest "Knödelhütte" of the Institute of Silviculture of the University of Natural Resources and Life Sciences in the western part of Vienna, which is on a south-west slope of eastern Vienna Woods with an area of 8.5 ha (48°13’, 16°14’ E, 290m a.s.l). The study area is part of the sub-continental transition zone with warm, dry summers. In growing seasons (May to September), the mean temperature is 16°C and annual precipitation is 450 mm (Mayer et al.1982). It is also the potential fire season in Austria, and we take it as our sampling period. The study area is found in the transition area between the spruce-fir-beech forest of the northern rim Alps and the mixed oak forests of the eastern Alps of the subpannonian Vienna Basin. It is composed of mixed and pure forest stands with Norway Spruce (Picea abies), Black Pine (Pinus nigra, Pinus jeffreyi, Pinus rigida), European Larch (Larix decidua) and Douglas Fir (Pseudotsuga menziesii) occurring the most frequently throughout (Fig.1). The original intention of the study area was the analysis of the growth performance of several tree provenances under local conditions (Mayer et al.1982).

Table 1:. Structural characteristics of investigated forest stands in the nursery and experimental forest / Tabelle 1: Charakterisierung der untersuchten Waldbestände in dem forstlichen Versuchsgarten und Baumschule
The study area consisted of diverse cover types, including several pure and mixed forest stands interspersed with open areas. As the main goal of this study was to explore fuel stick moisture exchange in coniferous forests, five coniferous forest stands dominated by pine (n=3), spruce (n=1) and larch (n=1), respectively, were selected within the study area (Fig. 1). In addition, one unforested area was selected as a control stand. All the sampled forest stands occurred within an elevation of 290 m, a slope of 3’, and were facing south-west. Geomorphology and climatic conditions were similar among the forest stands, with plant species and vegetation structure being the most distinctive characteristics (Table 1).
2.2 Sampling methods
Standardized fuel sticks are commonly used as a substitute for natural fuels to estimate the moisture content of dead fuels (Storey 1965, Nelson Jr. 2000). In the present study we assume this relationship is true also for forest fuelbeds in Austria based on evidence from previous studies in the Alps (Schunk et al 2014). Three sizes of fuel sticks with diameters of 0.6 cm, 2.5 cm and 6 cm were applied, as these sizes can be designated in terms of 1-hour, 10-hour and 100-hour time lag (Carlson 2007). The fuel stick moisture content is the affiliated water weight divided by the stick’s oven-dry weight in percentage. The material of the sticks was based on Norway spruce (Picea abies) wood with 40-50 cm length. Dry weight of all sticks was measured before and after finalizing the measuring to find weathering-caused weight loss.
One stick of each size group was placed on a supporting rack 30 cm above ground level. There were three such racks in the plots D, Q, R, S, and two in plots T and M, with approximately 2 meters distance from each other. All sticks were acclimatized in their assigned plots for at least 7 days before measurements began. Small- and medium-sized sticks were replaced every three months and large ones every five months, in case of error caused by material weathering (Deeming et al. 1977, Harrington 2014).
Measurements were conducted three times a week at 1400 Local Standard Time (LST). If precipitation was observed 10 hours before 1400 LST (rain or heavy dew), the measuring was postponed to the next day with dry weather. Measurements lasted through the fire season from late April to late October / early November depending on the year. The weight of the sticks was measured in a wind-free house in the experimental garden. Small sticks were measured first due to the short time lag in adapting to changing conditions.
In each forest stand, one automated weather station was installed 30 cm above ground, with approximately the same height as and equidistant (ca. 2 m) to all racks for observing hourly readings of temperature and relative humidity. Besides the near-surface temperature, a sensor device measured the temperature 5 cm beneath the surface in the litter or duff layer. For some days when the relative humidity was too high to be truly measured, the humidity was estimated based on the measured temperature. The vapor pressure was observed to be constant in all stands to ensure that such calculations are valid (personal communication with David Leidinger).
Hemiphotos were captured at each rack 1.3 m above ground level in October 2012. Analysis of these photos provided a measure for canopy cover, sky fraction, and global site factor. Canopy cover and sky fraction were obtained from the hemispherical photos using the Hemiview software (Rich 1990). Canopy cover represents the stand closure that may influence humidity by increasing or slowing vaporization, while sky fraction reflects the intensity of direct solar radiation (direct site factor) and indirect solar radiation (diffuse site factor) from all directions during daytime. Global site factor is the proportion of global radiation (direct plus diffuse) under the canopy relative to the radiation in the open (Anderson 1964, Rich et al. 1996). These factors help to characterize the relationship between moisture content and forest structure.
2.3 Calculating fine fuel moisture index
Multiple fire danger rating systems (e.g. Canadian Forest Fire Danger Rating System (CFFDRS), National Forest Danger Rating System (NFDRS)) are used to predict fuel moisture and the related fire danger level based on observed weather data. The CFFDRS uses a basic physical model that was calibrated with empirical field observations, while the NFDRS uses detailed physical models based on experiments (Wotton 2009). In the NFDRS natural fuels are categorized into 1-hour, 10-hour and 100-hour classes considering the time required for a woody sample to absorb or adsorb about 63% of the original moisture values within an unchanged environment (Byram et al. 2015). The standardized fuel sticks are commonly used to estimate the moisture content of dead fuels according to these time-lag classes (Carlson et al. 2007). The Fine Fuel Moisture Code (FFMC) is a key component of the Canadian Forest Fire Danger Rating System (CFFDRS), which was originally designed for coniferous forests and gradually used across the world in different environmental contexts (Wotton 2009). The FFMC provides a numeric rating of the moisture content of litter and fine fuels indicating the relative ease of ignition (Van Wagner 1987). FFMC usually correlates inversely with the fuel moisture of fine dead fuels (higher FFMC values relate to lower fuel moisture), and in the present study we assume this relationship is true also for forest fuelbeds in Austria. It was shown that the Canadian Forest Fire Weather Index (FWI) was one of the most reliable indices for predicting fire danger in Austria along with its sub components BUI (Buildup Index) and FFMC for certain regions (Arpaci et al. 2013). We therefore used the observed daily weather data (tmin, tmax, tmean, precipitation, humidity and wind speed) from the weather station at the experimental forest and nursey to calculate the FWI and its components according to Arpaci et al. (2013).
2.4 Data analysis
One-way ANOVA was used to test the difference of fuel stick moisture values of different stick sizes among all study plots and thereafter a post hoc test was applied to group stands according to their homogeneity. All 16 study plots were regrouped with hierarchical cluster analysis on the basis of both sky fraction and moisture content.
In order to check how the fuel stick moisture values correlate with the Fine Fuel Moisture Code (FFMC) a change rate (CR) was defined using the following equation:

This describes the percentage increase or decrease of a measurement (M) of fuel moisture (FM) or FFMC on a focal measuring dayi compared to a measurements on other measuring dayj. In this context, the CR are from measures (M) on adjacent measuring days.
An initial analysis with all data recordings showed that a few of the measurements were taken on wet days, resulting in some extreme outliers regarding the fuel moisture. We excluded from the analysis those measurements during days where moisture was measured at the upper 5th percentile of all sampling days. Statistical analyses were conducted using SPSS. We used an alpha level of 0.05 for all statistical comparisons. Only statistically significant differences and correlations are reported.
3. Results

Table 2: Average temperature and relative humidity values at 1200 LST from 26th, April to 3rd, October for the years 2012 and 2013 of the study area in eastern Austria / Tabelle 2: Durchschnittliche Temperatur und relative Luftfeuchtigkeit zwischen 26. April und 3. Oktober für die Jahre 2012 und 2013 im Untersuchungsgebiet im Osten Österreichs
3.1 Characterizing stick moisture content
Annual and seasonal differences
Mean fuel moisture content (median value of all stick classes) was higher in the fire season from April to October of year 2012 (16%) than that of year 2013 (14.7%). In both years, there were a number of outliers due to the varied weather conditions in the sampling period.
Recorded weather conditions at the weather stations in the nursery differed between sampling years; 2013 was warmer and drier than in 2012 (Tab. 2). The differences in the open stand area M (control stand) were more pronounced than in the forested stands.
In order to better characterize environmental conditions in each season, the recorded moisture content (MC) values were classified in three periods: pre-summer, summer and post-summer. The first and last appearance of the maximum temperature of the day higher than 30 degree was used as the cutting value (measurements conducted before the first 30 degree day were included in the pre-summer period, measurements after the last 30 degree day of the whole fire season were in the post-summer period) to classify the whole sampling course. Median MC decreased from the pre-summer period to the summer and increased in the post-summer period in 2013, as did the range of the MC value (Fig.1). In 2012, this trend was not observed; median MC increased during the three periods of the year, and the range of the MC value decreased and then increased as in 2013. In the pre-summer period, variation in MC of all three stick sizes was large but decreasing between each successive season. In the summer period the changes in MC are comparatively smaller than in the pre-summer period, indicating the dry and more stable weather conditions during summer. The range of MC values for the small sticks was narrower during summer period compared to the other periods, while that of the medium stick did not change significantly between seasons until the post-summer period (Fig. 2).
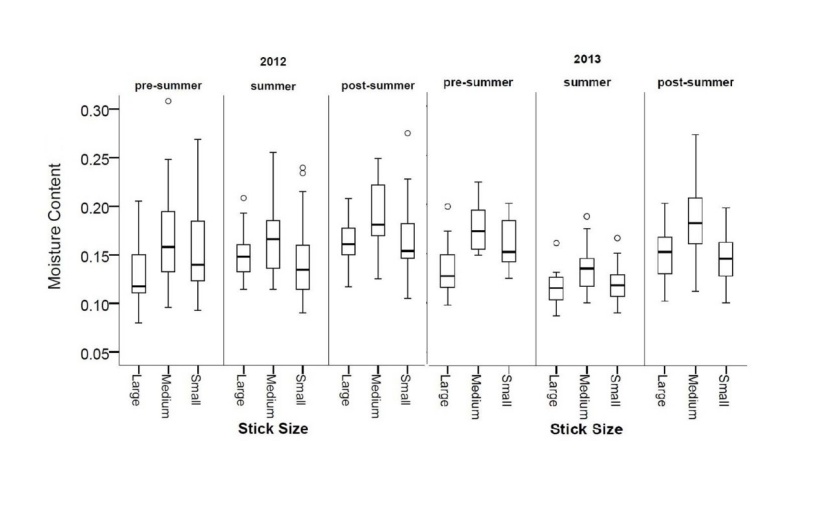
Figure 2: Moisture content of all stick sizes in different seasons in 2012 and 2013 / Abbildung 2: Holzfeuchtegehalt unterschiedlicher Kategorien von Brennmaterialien in den Beobachtungszeiträumen 2012 und 2013
Correlation between fuel stick moisture and fine fuel moisture code
FFMC values were negatively correlated with fuel stick moisture for almost all stands and stick size classes, except for the small sticks in stand M (p=0.027) and in stand T (p=0.058) during 2012 (Tab. 3).
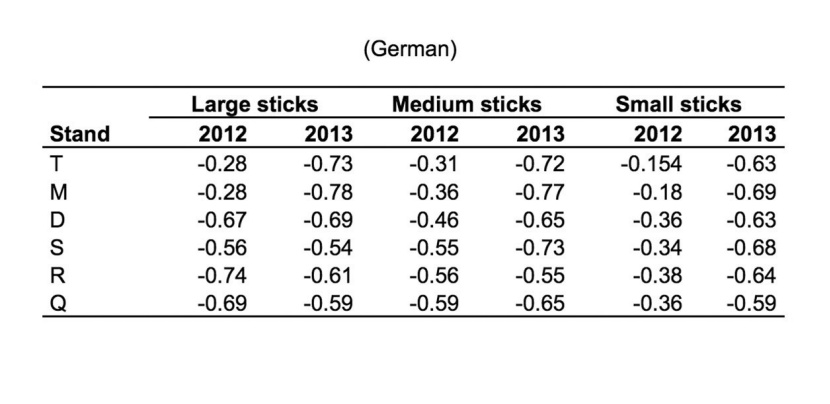
Table 3: Correlation coefficients between FFMC and fuel stick moisture for all stick sizes in year 2012 and 2013 / Tabelle 3: Korrelationskoeffizienten für die Relation zwischen FFMC und Holzfeuchte für alle Größenklassen der Brennmaterialien in den Jahren 2012 und 2013
The changing rates of FFMC and fuel stick moisture were correlated over an interval of one or two measuring days, and the correlation was strongest for the large sticks (Fig. 3). The correlation decreased from an interval of one to two measuring days for large sticks.
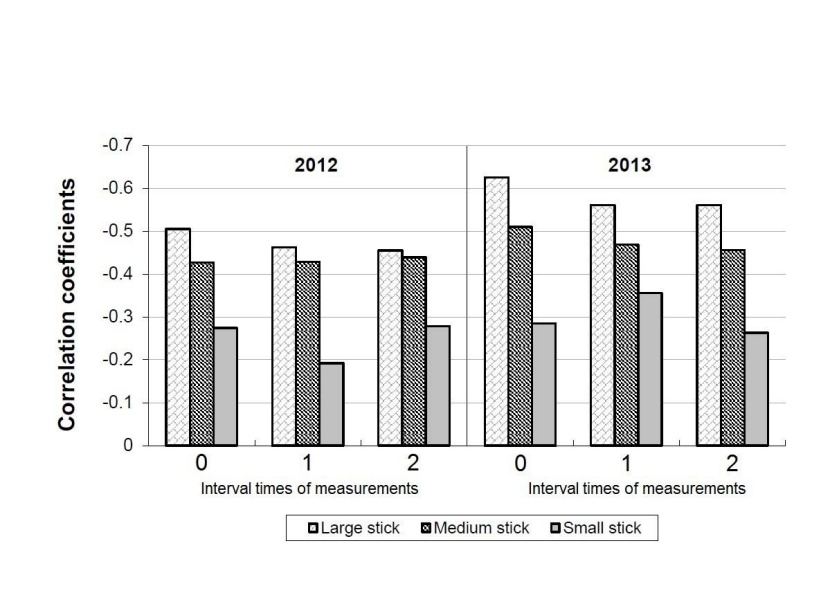
Figure 3: Correlation coefficients of change rate (CR) of FFMC and fuel stick moisture of all size in year 2012 and 2013 / Abbildung 3: Korrelations Koeffizienten zwischen Veränderungsrate (CR) des FFMC und Holzfeuchtegehalt unterschiedlicher Kategorien von Brennmaterialien in den Beobachtungszeiträumen 2012 und 2013
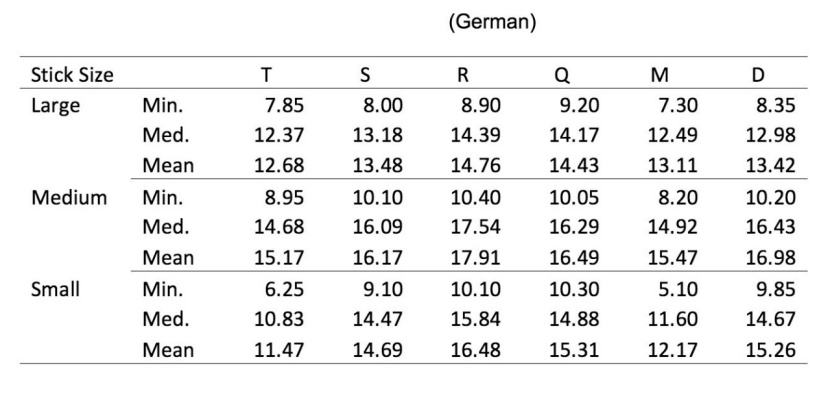
Table 4: Minimum, median and mean value of moisture content of different stick sizes in different stands / Tabelle 4: Minimum, Median und arith. Mittel der Holzfeuchte für alle Größenklassen der Brennmaterialien
Differences of moisture content in fuel stick sizes and stand types
Differences in moisture content (MC) were observed between stick size and stand characteristics in both years. The mean value of MC was higher than the median for all stick sizes, and the small and medium sticks had a considerable amount of outliers. Of all three stick sizes, large sticks had the lowest mean MC (13.7%) and the medium sticks had the highest mean MC (16.4%). The median MC of the fuel sticks in stand T (12.9%) was lower than in all other stands, followed by stand M (13.4%). Stand R had the highest MC of all stands (16.2%) (Tab. 4).
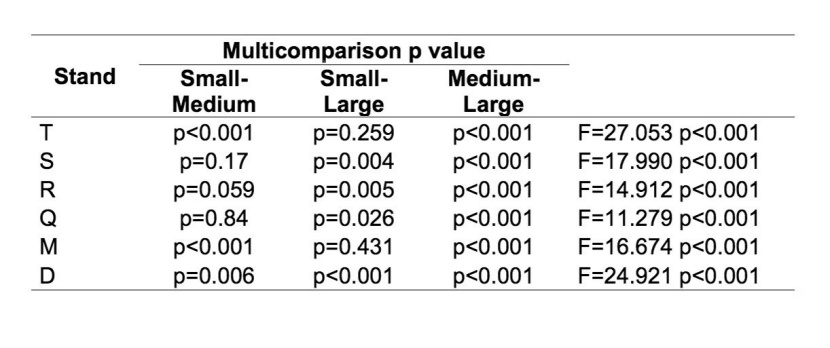
Table 5: ANOVA for comparing moisture content among fuel-stick sizes for each of the six forest stands / Tabelle 5: ANOVA Werte für den Vergleich der Holzfeuchtegehalte unterschiedlicher Kategorien von Holzstäben in den 6 untersuchten Waldbeständen
There were significant differences in fuel moisture between the size classes (F=87.625 p<0.001), and medium sticks had the highest mean MC compared to other sizes in all stands. Small sticks had the lowest mean MC in stand T and M, while in the other stands the mean MC of the large sticks is the lowest (Fig. 4a and 4b). There were significant differences regarding the MC between medium and large sticks for all stands. In stand T and M, small and large sticks differed significantly in the medium sticks. In stand S, R and Q, small and medium sticks differed significantly from the large sticks, and in stand D, all stick sizes differ greatly (Tab. 5).
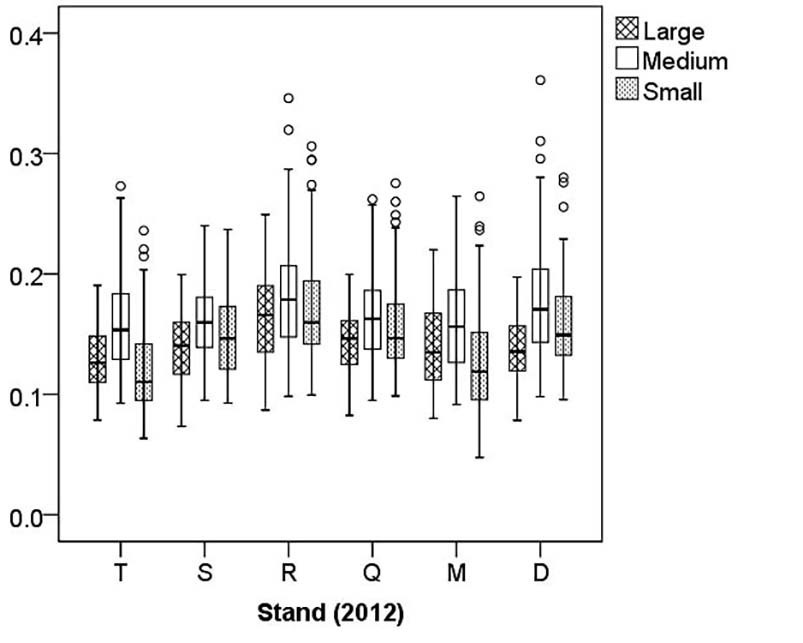
Figure 4a and 4b: Moisture content of all stick sizes in different seasons in 2012 and 2013 / Abbildung 4a und 4b: Holzfeuchtegehalt unterschiedlicher Kategorien von Brennmaterialien in den Beobachtungszeiträumen 2012 und 2013
Although the ANOVA analysis of the MC indicated that there were significant differences in MC among the stands (p<0.001), only stand R differed significantly from other stands. All together the differences regarding the mean MC values between both small and large fuel sticks compared to the medium fuel sticks where larger in the dry year 2013 (Fig 4a and 4b).
3.2 Correlations between stand characteristics and moisture content
Plot M (no standing trees) had the highest GSF and lowest canopy cover (no standing tree on the control stand). Sky fraction for stand T (dominated by black pine under moderate stand closure and more than12-m crown basal height) was greater than any other plot. In control stand M, the stand closure was nearly zero, (could be seen as clear-cut open area) but the surrounding trees raised the sky fraction slightly. In this context, it is very likely that same sky fraction performs differently in sunny and cloudy days. MC was negatively correlated with the sky fraction (Fig. 5).
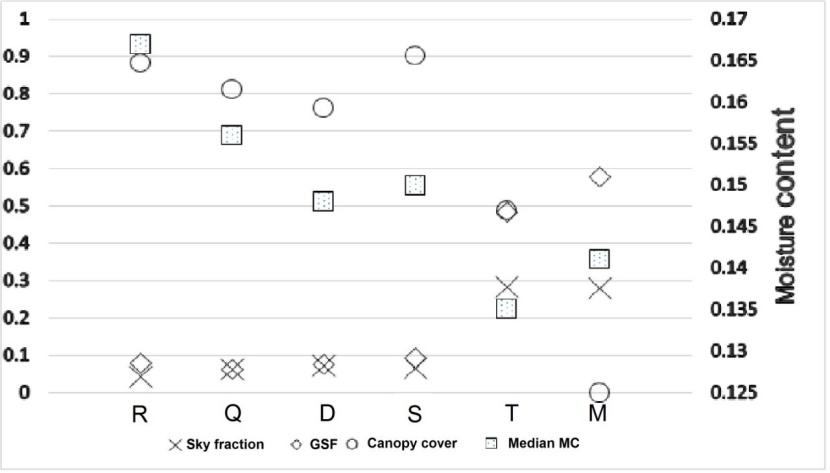
Figure 5: Sky fraction, global site factor, canopy coverage and median moisture content of six stands / Abbildung 5: Sky fraction, Global Site Factor, Bodenbedeckung und Median des Holzfeuchtegehalts in den 6 Waldbeständen
Mean MC of the sticks on each of the three plots should represent the average stand conditions. However, the micro site conditions of these plots may vary even though they are allocated in the same stand. Based on the hierarchical cluster analysis, racks were clustered into 5 groups according to sky fraction: 1) all 6 racks from plots T and M; 2) racks D1, D2 and S1;,3) racks D3, Q2, Q3, and S2; 4) Q1and S3; and 5) all 3 racks from plot R. A clustering has also been made on the basis of the MC for each of the 16 plots. The clustering is slightly different to the sky fraction and also within the two years due to the different climate situation (Figure 2 in the appendix indicates the final groups using the moisture values of the year 2013).
The sky fraction was correlated negatively with MC independent of stick size (Fig. 6).
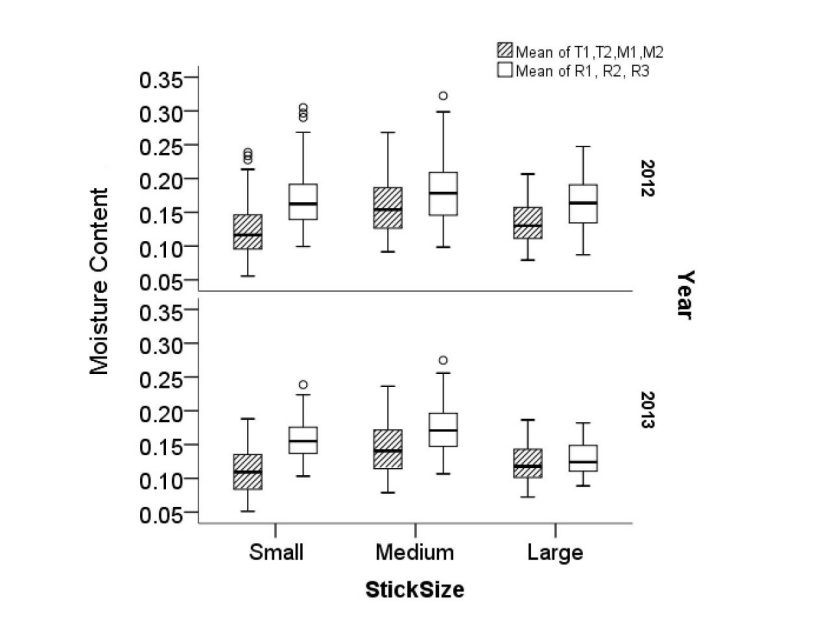
Figure 6: Moisture content of all size sticks from plots ranging from upper and lower ends of the sky fraction / Abbildung 6: Holzfeuchtegehalt der drei Kategorien von Brennmaterialien auf den untersuchten Plots bei unterschiedlichen Bedingungen des Kronenschlusses
4. Discussion
The likelihood of fire ignition is driven by fuel moisture, which is influenced by temperature and relative humidity. In this context the forest conditions influence solar radiation, rainfall throughflow and wind speed, which leads to different fuel moisture conditions. Consequently, forest structure (characterized by canopy closure, vertical structure, and tree density) can be seen as a proxy to characterize environmental conditions and fuel moisture. This study explored relationships between forest stand structure and fuel stick moisture content (MC) by analysing differences in MC among three fuel-stick size classes during two consecutive fire seasons in 2012 and 2013.
4.1 Fuel stick moisture characteristics
In our study the climatic conditions differed substantially between the two study years (Tab.2), which was reflected by MC for all stick sizes. As the year 2013 was warmer and drier, there was a higher chance that during this longer and drier period the moisture could reach an extreme dry state in the wood. This observation is similar to Estes et al. (2012), who found that forest structure had no significant relationship with MC during very dry periods. When MC is high, differences between forest stands with varying structures tend to be significant (Estes et al. 2012, Whitehead et al. 2006). In our study the dry period was shorter in 2013, which allowed us to detect a lower MC of sticks in plots with a high sky fraction (T and M) compared to those in plots with low sky fraction. We also found that MC varied among stick sizes, and this finding was consistent across sampled cover types. MC in smaller sticks reacts quickly to changing weather conditions, and even subtle differences between cover types could then be amplified and reflected more than that by larger sticks. Under open-canopy conditions the interception of moisture by the canopy is small, and more precipitation will reach fuel sticks on the forest floor (Whitehead et al. 2006). In this case, medium and large sticks would show a longer timelag in the response to changing environmental conditions and prove to be less influenced by precipitation than smaller sticks. The strong and consistent correlation we found between FFMC values and fuel moisture values of medium and large sticks supports this hypothesis. The duff moisture code and drought code are key components of the build up index (BUI) which has proven to be a reliable proxy for predicting fire danger in Austria as well (Arpaci et al. 2013). Therefore further studies have to be done in order to better capture the changing fuel moisture of different fuel classes with fire weather indices.
4.2 Relationship between stand structure and fuel stick moisture
Sampled forest stands with a more open canopy and higher insolation had less fuel moisture compared to stands with a more closed canopy. On dry and sunny days, direct solar radiation causes high temperature and low relative humidity (Reifsnyder 1972), thus much loss of stick moisture to the extremes. As suggested by Estes et al. (2012), thinning can affect surface moisture by changing the quantity and composition of the understory vegetation. Forest stand R has the lowest sky fraction, along with well-grown understory, harboring the highest MC of all stands. Stand Q is a Norway spruce-dominated stand and has a little smaller sky fraction but moister condition than stand S, which is dominated by scots pine. Forests dominated by scots pine have been shown to support an ignition much stronger than a Norway spruce-dominated forest (Tanskanen et al. 2005), and Norway spruce forests create a higher moisture in-stand microclimate (Stenberg et al. 1994). Our findings supported this hypothesis, as the fuel moisture in the Norway spruce stand was higher that of the scots pine stand.
Vegetation structure within each sampled cover type varies across space. In particular, sky fraction, which could be regarded as proxy of vegetation characteristics (canopy closure, tree density, understory growth), has been shown to be a good predictor of MC in fuel sticks. Independent of sky fraction, sticks near an opening within a forest or with an open understory endure more wind and stronger air circulation compared to those within the interior of a forest or those surrounded by dense understory. This micro-level hypothesis was supported by our finding that a study plot with black pine (T2) had the lowest MC values and highest sky fraction. When differences in sky fraction between study plots become smaller, however, we found more exceptions for the large sticks. In particular, within forest stands dominated by pine (T and M), MC was higher even though the canopy was more open than in almost half of the other plots. Macroclimate factors such as precipitation-free days and seasonal weather variation (Estes et al. 2012) might have had more significant influence on MC in these stands.
For future research, the fuel moisture values estimated in our study can be combined with fire ignition experiments involving dead fuel to determine thresholds for fire ignition (de Groot et al. 2005, Bianchi & Defosse, 2014). This will allow a better interpretation of the FFMC values with regard to different fuel types and related stand characteristics. As the fuel sticks were measured on standardized racks 30 cm above the ground, the drying effect of wind might be enhanced and the wetting effect of rainfall might be weakened to some extent. However, the correlation between fuel moisture and FFMC values could be still considered as reliable.
4.3 Measuring procedures
Large sticks in our study usually had the lowest MC values, and large and small sized sticks were found to have lower MC than that of medium sticks independently from the year of observation. This finding is in contrast to the study by Carlson (2007) in which the 1-hour fuel stick had the lowest median MC and 100-hour fuel stick the highest MC. The sampling method in that study differed from our study. Sticks were measured every day regardless of rainfall and weighed with water on the surface. In our study, measuring was done at 1400 LST, when no precipitation was recorded for the past 10 hours. As the small sticks’ timelag is 1 hour, their MC can be influenced by the environmental situation very quickly. Furthermore, our measuring efforts always occurred in the afternoon in a dry environment when the MC is comparably low. The large sticks have a long time lag, as they interact with the environment very slowly and therefore document environmental changes over longer time periods. The medium sticks have an approximately 10-hour time lag, which usually starts from late night with lowest temperature to the measuring time with highest temperature of the day. When experiencing continuously changing environment within the scale of this time lag, especially low temperature and high humidity in the morning, the medium sticks have insufficient time to reach equilibrium and tend to have comparably higher MC compared to sticks of other sizes.
Storey (1965) found that the loss of weight of the fuel sticks could strongly influence MC measurements as well. The slight weight loss could be considered as a normal weathering effect, while increasing weight in some cases is very likely due to operation error. In our study, however, none of the stick-size groups had significant weight loss after 3-5 months sampling activity (no significant differences with paired T-test).
In this study all data from every sampling day were initially analysed, but we found several extreme values that if included could severely affect the MC estimates. These extreme values arise from either measuring under unsuitable weather conditions (e.g., undetected precipitation in the early morning or unexpected rainfall within the measuring procedure) or poor operation and documentation that are difficult to detect and correct during post-processing of the data. When MC increases, variability of data increase (Wotton et al. 2007), so in order to improve the statistical analysis, the upper 5th percentile of rack-specific MC values were excluded from both years of sampling, namely four of 82 readings in 2012 and three of 62 readings in 2013. While removing extreme outliers, we found that the highest values in the open stand (M) occurred during days that were not noticeably wetter than other days. By contrast in the more closed stands, extreme values occurred on relatively wet days. This indicates that fuel moisture in closed stands tends to stay high under wet weather conditions for a certain period, while under more open stands the high fuel moisture values decrease quickly to normal levels following precipitation events.
Acknowledgements
We are thankful to Franz Reinthaler, Christoph Wolfram and Johann Hable of the nursery and experimental garden Knödelhütte in supporting us in the data collecting. We would like to thank David Leidinger for his help in installing the weather stations and providing the data and Herwig Ruprecht for supporting the analysis of the hemispherical photo data. Raphael Klumpp provided much support in arranging sampling activities in the nursery and experimental garden. Additionally we would like to thank the reviewers for providing good recommendations to improve an earlier version of this manuscript.
References
AFI, (2012). Austrian Forest Inventory, Federal Research and Training Centre for Forests, Natural Hazards and Landscape, Vienna, Austria.
Anderson MC, (1964). Light relations of terrestrial plant communities and their measurement. Biological Reviews, 39(4), pp. 425-481.
Arpaci A, Eastaugh CS, Vacik H (2013). Selecting the best performing fire weather indices for Austrian ecoregions. Theoretical and Applied Climatology, 114(3-4), pp. 393-406.
Arpaci A, Malowerschnig B, Sass O, Vacik H (2014). Using multi variate data mining techniques for estimating fire susceptibility of Tyrolean forests. Applied Geography, 53, pp. 258-270.
Lawson BD, Armitage OB (2008). Weather guide for the Canadian forest fire danger rating system. Northern Forestry Centre. Alberta, CA, pp.73.
Bianchi LO, Defosse GE (2014). Ignition probability of fine dead surface fuels of native Patagonian forests of Argentina. Forest Systems, 23(1), pp. 129-138.
Byram GM, Nelson RM (2015). An analysis of the drying process in forest fuel material. Unpublished paper presented at the 1963 international symposium on humidity and moisture; 1963 May 20-23; Washington, DC, pp. 38.
Carlson JD, Bradshaw LS, Nelson RM, Bensch RR, Jabrzemski R (2007). Application of the Nelson model to four timelag fuel classes using Oklahoma field observations: model evaluation and comparison with National Fire Danger Rating System algorithms. International Journal of Wildland Fire,16(2), pp. 204-216.
Deeming JE, Burgan RE, Cohen JD (1977). The National Fire-Danger Rating System. USDA Forest Service Research Paper RM-84, USDA Forest Service, Rocky Mountain Forest and Range Experiment Station, Fort Collins, USA, pp.165.
de Groot WJ, Wang Y (2005). Calibrating the fine fuel moisture code for grass ignition potential in Sumatra, Indonesia. International Journal of Wildland Fire, 14(2), pp. 161-168.
Estes BL, Knapp EE, Skinner CN, Uzoh FC (2012). Seasonal variation in surface fuel moisture between unthinned and thinned mixed conifer forest, northern California, USA. International Journal of Wildland Fire, 21(4), pp. 428-435.
Hartford RA, Rothermel RC (1991). Fuel moisture as measured and predicted during the 1988 fires in Yellowstone Park. United States Department of Agriculture. Forest Service, Research Note INT-396. Intermountain Research Station, Ogden, Utah. pp.7.
Harrington MG (1983). Climate class adjustments improve accuracy of predicted fuel moisture stick values. USDA Forest Service Research Paper RM-431, USDA Forest Service, Rocky Mountain Forest and Range Experiment Station, Fort Collins, USA, pp.4.
Matthews S (2014). Dead fuel moisture research: 1991–2012. International journal of wildland fire, 23(1), pp. 78-92.
Mayer H, Reimoser F, Kral F (1982). Ergebnisse des Internationalen Tannenherkunftsversuches wien 1967-1978. Morphologie und Wuchsverhalten der provenienzen. Centralblattfur das gesamte Forstwesen. [Mayer H, Reimoser F, Kral F (1982). Results of the international experiment on fir origin Vienna 1967-1978. Morphology and grew behave of the provenances. Central paper of forestry.] pp. 109-138.
Müller MM, Vacik H, Valese E (2015). Anomalies of the Austrian Forest Fire Regime in Comparison with Other Alpine Countries: A Research Note. Forests, 6(4), pp. 903-913.
Nelson JrRM (2000). Prediction of diurnal change in 10-h fuel stick moisture content. Canadian Journal of Forest Research, 30(7), pp. 1071-1087.
Page WG, Jenkins MJ, Alexander ME (2013). Foliar moisture content variations in lodgepole pine over the diurnal cycle during the red stage of mountain pine beetle attack. Environmental Modelling & Software, 49, pp. 98-102.
Reifsnyder WE, Furnival GM, Horowitz JL (1972). Spatial and temporal distribution of solar radiation beneath forest canopies. Agricultural Meteorology, 9, pp. 21-37.
Rich PM (1990). Characterizing plant canopies with hemispherical photographs. Remote sensing reviews, 5(1), pp. 13-29.
Rich PM, Wood J, Vieglais DA, Burek K, Webb N (1996). HemiView Manual Revision Number: 2.1. Kansas, USA. pp. 20-45.
Rothermel RC (1972). A mathematical model for predicting fire spread in wildland fuels. USDA Forest Service Research Paper INT-115. Washington DC. USA. pp. 40.
Schadauer K, Gschwantner T, Gabler K (2005). Austrian national forest inventory: caught in the past and heading toward the future. In: Proceedings of the “Seventh Annual Forest Inventory and Analysis Symposium” (McRoberts RE ed). 3-6 October 2005. Portland, ME, USA, pp. 47-53
Schunk C Leuchner M Menzel A (2014). Evaluation of a system for automatic dead fine fuel moisture measurements. In: Viegas DX (ed): Advances in Forest Fire Research. Coimbra, Portugal, ISBN 978-989-26-0884-6, pp. 1115-1123
Scott JH, Reinhardt ED (2001). Assessing crown fire potential by linking models of surface and crown fire behaviour. USDA Forest Service Rocky Mountain Research Station Research Paper RMRS-RP-29. pp.59.
Stenberg P Kuuluvainen T Kellomäki S Grace JC, Jokela EJ, Gholz HL (1994). Crown structure, light interception and productivity of pine trees and stands. Ecological Bulletins, pp. 20-34.
Storey TG (1965). Estimating the fuel moisture content of indicator sticks from selected weather variables. Res. Paper PSW-RP-26. Berkeley, CA: Pacific Southwest Forest & Range Experiment Station, Forest Service, U.S. Department of Agriculture; pp.14.
Tanskanen H, Venäläinen A, Puttonen P, Granström A (2005). Impact of stand structure on surface fire ignition potential in Picea abies and Pinus sylvestris forests in southern Finland. Canadian Journal of Forest Research,35(2), pp. 410-420.
Vacik H, Arndt N, Arpaci A, Koch V, Mueller M, Gossow H (2011). Characterisation of forest fires in Austria. Austrian Journal of Forest Science,128(1), pp. 1-31.
Van Wagner CE, Forest P (1987). Development and Structure of the Canadian Forest Fire Weather Index System. In Canadian Forestry Service, Forestry Technical Report 35. Ottawa, CA. pp. 37
Viegas DX, Viegas MTSP, Ferreira AD (1992) Moisture Content of Fine Forest Fuels and Fire Occurrence in Central Portugal. International Journal of Wildland Fire 2, pp. 69–86.
Viney NR (1991). A review of fine fuel moisture modelling. International Journal of Wildland Fire, 1(4), pp. 215-234.
Whitehead RJ, Russo GL, Hawkes BC, Taylor SW, Brown BN, Barclay HJ, Benton RA (2006). Effect of a spaced thinning in mature lodgepole pine on within-stand microclimate and fine fuel moisture content. In proceedings of the “Fuels management—How to measure success” USDA For. Serv., Proc. RMRS-P-41, Fort Collins, CO. pp. 523-536.
Wotton BM, Beverly JL (2007). Stand-specific litter moisture content calibrations for the Canadian Fine Fuel Moisture Code. International Journal of WildlandFire, 16(4), pp. 463-472.
Wotton BM (2009). Interpreting and using outputs from the Canadian Forest Fire Danger Rating System in research applications. Environmental and Ecological Statistics, 16(2), pp. 107-131.
Xanthopoulos G, Wakimoto RH (1993). A time to ignition-temperature-moisture relationship for branches of three western conifers. Canadian Journal of Forest Research, 23(2), pp. 253-258.
Zumbrunnen T, Menéndez P, Bugmann H, Conedera M, Gimmi U, Bürgi M (2012). Human impacts on fire occurrence: a case study of hundred years of forest fires in a dry alpine valley in Switzerland. Regional Environmental Change, 12(4), pp. 935-949.


