Schlüsselbegriffe: Trieb; Nadelprojektionsfläche; Silhouette des Triebes; Baumkrone; Biomasse; Kronendach; Photosynthese; Allometrie; Picea abies; Assimilation; spezifische Blattfläche
Abstract
Estimation of newly grown needle area, as the most active part of assimilation apparatus, is important for better understanding of biochemical processes of trees. This paper investigates the relationship between the projected area of newly grown needles and other biometric tree parameters (tree height HTREE, diameter at breast height DBH, projected crown area and crown length) of Norway spruce trees. The total projected area of newly grown needles of seven sampled trees was estimated using a detailed inventory of the number and length of shoots. The relationship between this value and other readily measurable biometric tree characteristics was tested to find the best model for estimating total area of newly grown needles. The model using HTREE*DBH with a coefficient of determination of 0.96 had the best performance. The DBH and HTREE inventory of all trees in the studied plot was used to estimate the total projected area of newly grown needles of the entire forest stand (4506.7 m2 per hectare). We also investigated specific leaf area (SLA) of newly grown needles in vertical profile of tree crown. SLA increased constantly from the tree top (28.7 cm2.g2) to the crown base (80.3 cm2.g2).
Zusammenfassung
Die Ermittlung der jährlich neu gebildeten Nadelmasse als aktivster Teil der Assimilationsorgane eines Baumes ist sehr wichtig für ein besseres Verständnis der biochemischen Prozesse von Bäumen. Diese Studie beschreibt die Beziehung zwischen der Projektionsfläche von neu zugewachsenen Nadeln und der Baumhöhe (HTREE), des Stammdurchmesser in der Brusthöhe (DBH), der Projektionskronenfläche sowie der Kronenlänge der Gemeinen Fichte. Die gesamte Projektionsfläche von neu zugewachsenen Nadeln an sieben Probebäumen wurde mittels durch detaillierte Erfassung der Projektionsfläche von Nadeln und der Anzahl und Länge von neu zugewachsenen Trieben ermittelt. Das beste Modell erreichte mit dem Parameter HTREE*DBH ein Bestimmtheitsmass von 0.96. Aus Messunge von DBH und HTREE aller Bäume konnte die gesamten Projektionsfläche der neu zugewachsenen Nadeln des gesamten untersuchten Bestandes ermittelt werden (4506.7 m2 pro Hektar). Ausserdem, Es wurden auch die spezifische Blattfläche (SLA) für neu gebildete Nadeln im vertikalen Profil der Baumkrone untersucht. SLA nahm von dem Wipfel (28.7 cm2.g2) bis zur Kronenbasis (80.3 cm2.g2) stetig zu.
Introduction
Norway spruce (Picea abies (L.) Karst.) is one of the most important European coniferous tree species due its wide distribution, its economic importance and long tradition of cultivation (Caudullo et al. 2016). In the past, Norway spruce stands have often been favored because of their easy establishment, transparent management and high yield (Spiecker 2003).
Trees are growing in environment, where they constantly exchange matter and energy with atmosphere and soil. From the environment a plant must acquire resources that it can then save or spend in various ways to construct a product (Bloom 1985). The actual size of green leaf area is one of the key parameters influencing the total primary production of trees and the exchange of energy between trees and the atmosphere (Newman 1979). Solar energy is environmentally friendly and its conversion to energy of chemical substances is carried out only by photosynthesis – effective mechanism characteristic of plants (Tkemaladze and Makhashvili 2016). Tree crown architecture may be described by the vertical and horizontal distribution of plant organs, particularly focusing on the productive assimilation area (Echereme et al. 2015). The utilization of solar radiation (especially photosynthetically active radiation of wavelengths 400 – 700 nm) directly depends on tree crown architecture, its projected area and the forest stand structure (Mõttus et al. 2006; Pangle et al. 2009). The crown of Norway spruce is regularly conical and columnar, with whorled, short and stout branches, the upper level ascending and the lower drooping (Caudullo et al. 2016). The tree crown dimension is more easily measured by vertical crown length than by crown projection.
Forest stand production is closely connected with micro climatic conditions that are created within the forest stand. Incident solar radiation affects forest stand climate and is the exclusive source of energy for the production processes of the trees (Marková et al. 2011). Solar radiation is one of the most limiting factors in numerous processes of forest regeneration, stand development (Niinemets and Kull 1995) and radial growth (Beadle and Long 1985; Linder 1985; Monteith 1994). The size and distribution of the active assimilatory apparatus therefore plays a decisive and crucial role in forest growth and development.
The total leaf area of the plant can be obtained by either direct or indirect methods. Indirect, non-destructive methods are user friendly and provide robust leaf area estimates (Norman & Campbell, 1989). Another method would be removing and measuring all leaves of a plant. This direct method is destructive and can be used for model development. One of the most useful tools for assessment of total leaf area is specific leaf area (SLA). SLA uses relationship between the area of the representative mixed foliage sample with its dry weight (Kalácska et al. 2005; Nouvellon et al. 2010). SLA often serves as an indicator for potential growth rate and reacts very sensitively to changes of the availability of resources (Fellner et al. 2016).
The amount of needles growing on a tree influences photosynthesis, gas exchange, transpiration, the interception and utilization of inorganic and organic atmospheric pollutants and the leaching of substances from aerial plant surfaces (Riederer et al. 1988). Leaf area is therefore one of the most important structural characteristics of a tree or forest stand as it relates to its potential production or even health status (Pokorný and Stojnič 2012; Čater 2015). The amount of needles growing on a tree is adequately described using the projected area of needles. The young needles are photosynthetically highly active needles (Hom and Oechel 1983, Huttunen and Heikkilä 2001, Kayama et al. 2007) and net CO2 assimilation rates decrease with needle aging in the conifer species (Freeland 1952; Warren 2005).
The main objective of the study was to determine the area of newly grown needles in the crown layer. Models for estimating the projected area of newly grown needles using some easily measurable biometric characteristics of shoots have been developed. Sufficiently accurate equations for calculating the projected newly grown needle area of trees using tree biometric characteristics have been developed.
Material and Methods
Site description
The amount of newly grown needles in a young spruce monoculture (Picea abies (L.) Karst.) was determined at the Rájec study site (the Drahanská vrchovina Highlands, the Czech Republic) after the 2014 growing season (Table 1). The experimental station Rájec was founded in 1975 and is included in the International Long Term Ecological Research Network (ILTER) and national infrastructure for carbon observation in the Czech Republic - CzeCOS.
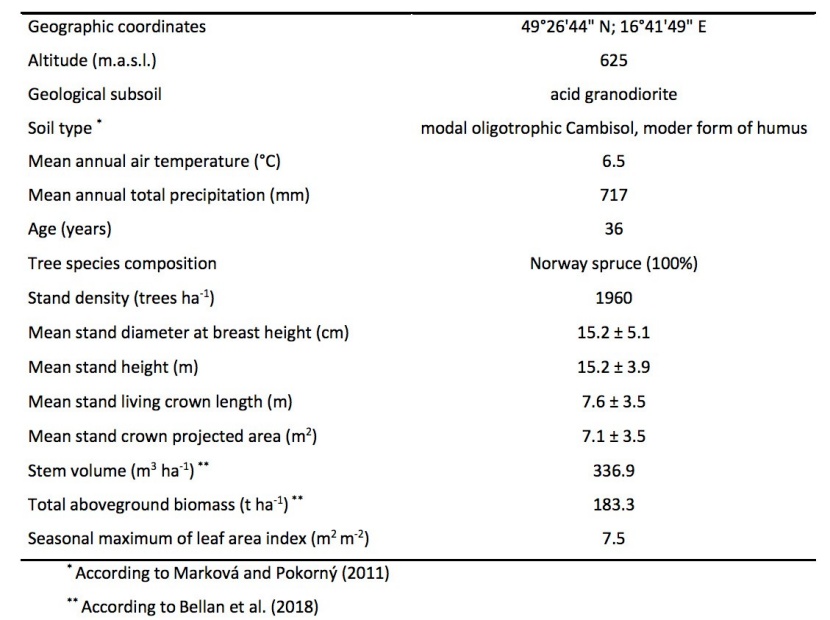
Table 1: A description of the study site in 2014 (mean ± standard deviation) / Tabelle 1: Beschreibung den untersuchten Fläche im Jahre 2014 (Mittelwert ± Standardabweichung)
The studied spruce monoculture was established through reforestation (5000 trees per ha) after a clearcut of a mature spruce stand in 1978 (Marková and Pokorný 2011). There were performed several thinnings in the experimental site, nevertheless none of them did not reduce amount of neighbors of studied trees at least ten years before investigation. Detailed analysis of the amount of newly grown needles was determined on seven selected trees growing in the forest stand, that are equipped with scaffolding that allowed for the taking of measurements in a vertical profile of tree crowns. Selected biometric characteristics of the studied spruce stand at the chosen experimental plot (four sampled plots with area 125 m2; 98 trees) are shown in Table 1.
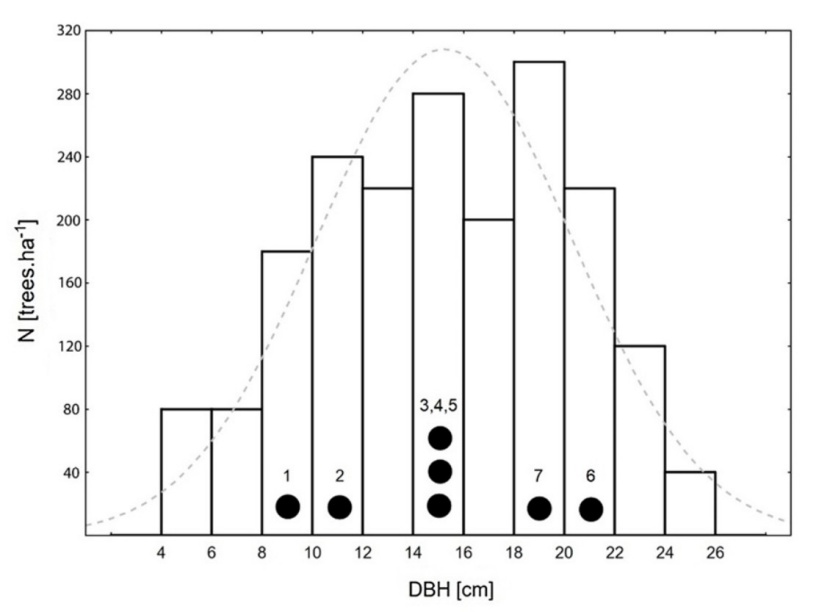
Figure 1: Diameter at breast height (DBH) distribution at the study site in 2014. Black points represent the selected studied trees with their numbers used in this paper. Dashed line is a normal distribution of DBH.
Abbildung 1: Verteilung der Brusthöhendurchmesser (DBH) der untersuchten Fläche im Jahre 2014. Schwarze Punkte repräsentieren die ausgewählten untersuchten Bäume und die in dieser Studie verwendete Nummerierung. Die gestrichelte Linie markiert eine Normalverteilung von DBH.
Needle level
The area of newly grown needles was observed on the seven selected trees (Fig. 1) throughout the whole tree crown profile at the end of the 2014 growing season. Newly grown shoots (16 per tree) were removed from three additional trees of different social status (dominant, co-dominant and subdominant; Fig. 2). These 48 shoots were selected following the shoot length distribution within the tree crown.
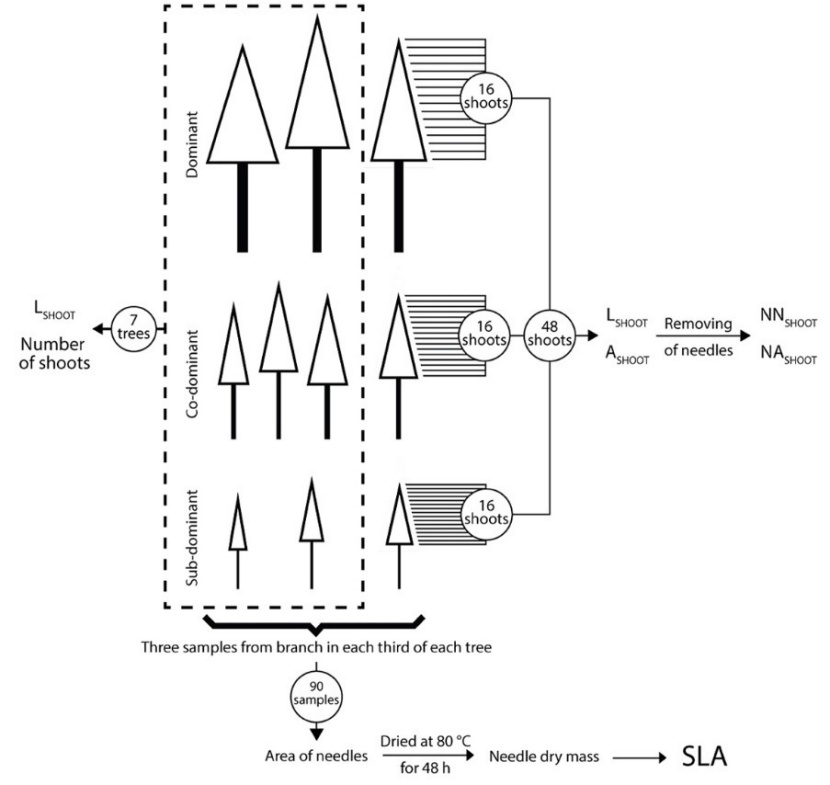
Figure 2: Methodology of sampling and analysis. LSHOOT - length of shoot in cm, ASHOOT - projected area of shoot in cm2, NNSHOOT - number of needles per shoot, NASHOOT - projected area of needles in cm2/shoot, SLA – specific leaf area (cm2.g-1). / Abbildung 2: Methodik der Probenahme und Analyse. LSHOOT - Länge des Triebes in cm, ASHOOT - projizierte Fläche des Triebes in cm2, NNSHOOT - Anzahl der Nadeln per Trieb, NASHOOT - projizierte Fläche der Nadeln in cm2/Trieb, SLA - Spezifische Blattfläche (cm2.g-1).
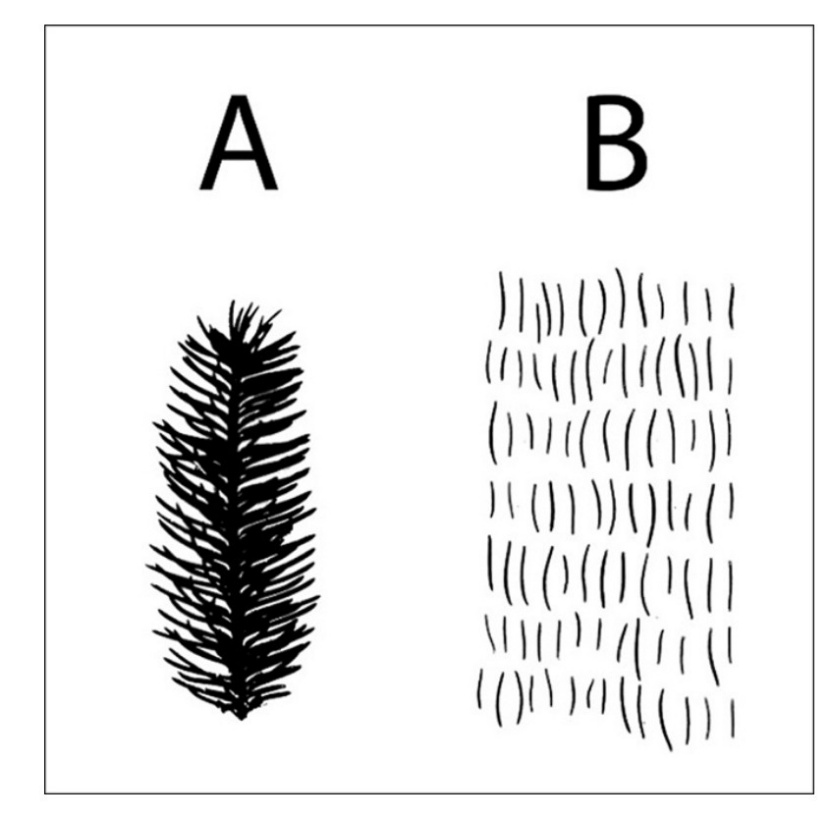
Figure 3: Newly grown shoot projection (A) and the projected area of needles separated from this shoot (B). / Abbildung 3: Neu gewachsener Trieb (A) und die projizierte Fläche, der von diesem Trieb abgetrennten Nadeln (B).
The length of the removed newly grown shoots (LSHOOT) was measured from the beginning of growth in the current year to the bottom of the new terminal bud and the area of removed newly grown needles (NASHOOT) was measured using image analysis. Images of the removed newly grown shoots were taken with a Nikon D5100 digital SLR camera (Nikon Corp., Japan) and a Tamron 17-50/F2.8 AF (Tamron Corp., Japan) lens set at 35-mm focal length for better optical quality. Images were captured in high resolution on a background marked with millimeter gridlines. The projected area of the removed shoot (ASHOOT) was captured on one side by the camera at a 90° angle loosely laid on a flat table (Fig. 3). Needles were separated from the shoot and scanned by an image scanner (Perfection V500, EPSON) (Fig. 3). NASHOOT, ASHOOT and number of needles (NNSHOOT) was determined from images by ImageJ (National Institutes of Health, USA). The parameters of the removed newly grown shoots (LSHOOT, NNSHOOT and NASHOOT) were further analyzed to assess the correlations between the projected area of needles and shoot characteristics.
The silhouette area to projected needle area ratio (SPAR) of a shoot is defined by Stenberg et al. (1995) as:

where ASHOOT (α,β) is the projected area of shoot for inclination (α), rotation angle (β), and NASHOOT is the projected needle area. SPAR was calculated only at α = 90° and β = 0° (i.e. the shoot projection area was determined only for a loosely laid shoot on flat table) and this parameter was described as SPARmax.
The shoot area to total needle area ratio (STARcal) was calculated after converting the projected needle area (NASHOOT) to total needle area (TNASHOOT) using the equation for one-year-old needles published by Homolová et al. (2013):

Specific leaf area (SLA, ratio between projected needle area and needle dry mass) was determined on ten trees growing in the studied forest stand (including the seven trees used in detailed analyses; Fig. 2). One sample branch was taken from each third of tree crown. Afterward three subsamples (consisting of approximately 50 needles each) were collected from each sample branch. Needle subsamples were scanned, oven-dried (at 80°C for 48 h) and weighed (precision ±0.001 g). Needle area of subsamples was determined by ImageJ (National Institutes of Health, USA).
Shoot level
The detailed analysis of newly grown shoots was performed on the seven selected studied trees throughout the whole tree crown at the end of the 2014 growing season (Fig. 2). The height of all living branches in whorls was measured during the shoot sampling period. The number of newly grown shoots was counted on every living branch in the whorl and in the inter-whorl. LSHOOT was measured on living branches in whorls along the whole vertical profile of the tree crown.
Tree and stand level
The position, height (HTREE), vertical length of the living crown (LCROWN) and projected crown area (PACROWN) of the selected studied trees and finally of all trees on the experimental plot were determined using the FieldMap measuring system (IFER, Czech Republic). The top of the highest tree and the lowest living whorl in the stand defines the height of the stand crown layer. The base of the living crown was considered the whorl closest to the ground surface that had a minimum of two living branches. DBH of the selected studied trees was calculated from the stem circumference measured with tape at a height of 1.3 m above the ground.
Tree crown dimension, as the potential base for budding, is directly related to the amount of newly grown shoots. Chosen tree and crown biometric characteristics are provided in Table 2. For the seven selected Norway spruce trees, the average DBH was 15.3 cm ± 4.0, and the average tree height was 15.5 m ± 3.3.
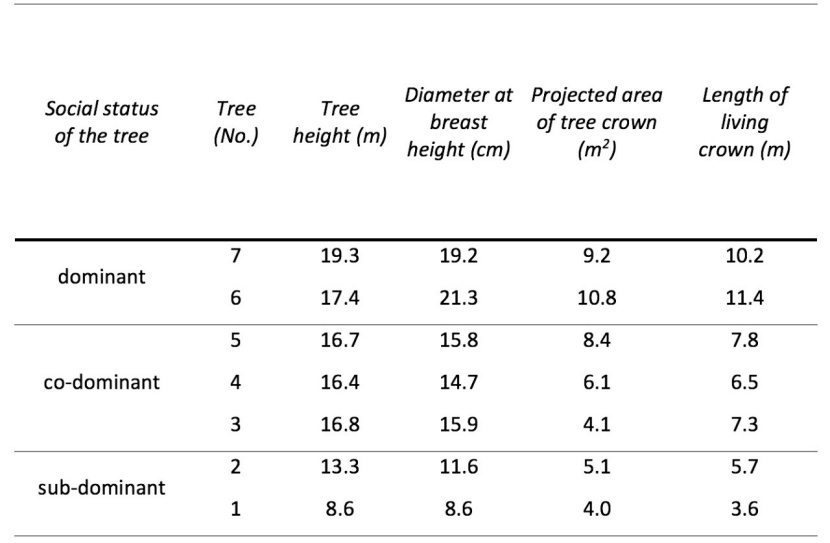
Table 2: Chosen biometric characteristics of the seven studied trees. Trees were divided into three categories according to their social status within the forest stand. / Tabelle 2: Ausgewählte biometrische Merkmale von sieben untersuchten Bäumen. Die Bäume wurden nach ihrem sozialen Status innerhalb des Bestandes in drei Kategorien unterteilt.
Statistical analysis
To determine the relationship between NASHOOT and an easily measurable shoot parameter, a list of measured newly grown shoot characteristics was established and the best model was estimated using QCExpert 3.3 (TriloByte Statistical Software Ltd 2013). Linear, exponential, polynomic, logarithmic and power models were tested and the quality of the models was evaluated based on (i) mean quadratic error of prediction (MEP), (ii) Akaike information criterion (AIC) and (iii) coefficient of determination (R2). MEP and AIC values are decreasing with increasing model quality, and higher R2 values indicate higher suitability of the model. MEP was the decisive factor in selecting the best model.
A list of the biometric characteristics of the seven studied trees (HTREE, DBH, PACROWN, LCROWN) was made to find the most appropriate and most suitable model to describe the total projected area of newly grown needles on a tree. The dependence of newly grown needles area on each of tree characteristic parameter was estimated in QCExpert 3.3 and SigmaPlot 11.0 (Systat Software, Inc.).
Results
Needles
The length of the 48 shoots removed from the subset of three trees (sub-dominant, co-dominant and dominant) ranged from 21.8 to 113.3 mm. The mean values of the biometric measurements performed on these 48 shoots, obtained through image analysis, are provided in Table 3. SPARmax varied from 0.299 to 0.662 with a mean value of 0.514. Shoot area to total needles area ratio (STARcal) (calculated with the conversion factor published by Homolová et al. 2013) ranged from 0.096 - 0.211 with a mean value of 0.164.
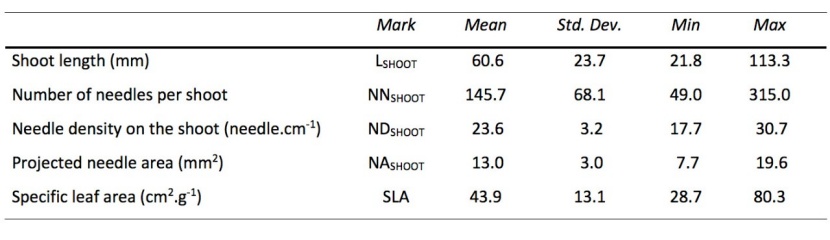
Table 3: Selected biometric characteristics of the 48 removed newly grown shoots. / Tabelle 3: Ausgewählte biometrische Merkmale von 48 neu gewachsenen Trieben.
New needle production estimated by the model was at an average of 188 453 needles per tree (according to relationship on Fig. 4 and model in Table 4). We detected a strong relationship (i) in shoot length versus the number of needles (R2 = 0.93)(Fig. 4), (ii) shoot length versus the projected area of newly grown needles (R2 = 0.91) (Fig. 5), and (iii) the projected area of shoot versus the projected area of newly grown needles (R2 = 0.93) (Fig. 5).
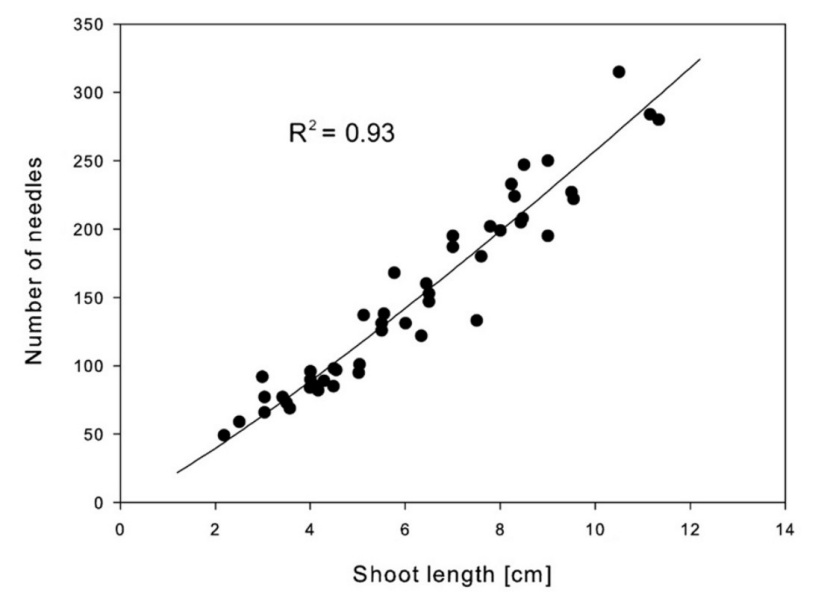
Figure 4: Relationship between number of needles and shoot length. See Table 4 for the model description. / Abbildung 4: Beziehung zwischen Anzahl der Nadeln und Trieblänge. Die Tabelle 4 stellt die Beschreibung der Modelle dar.
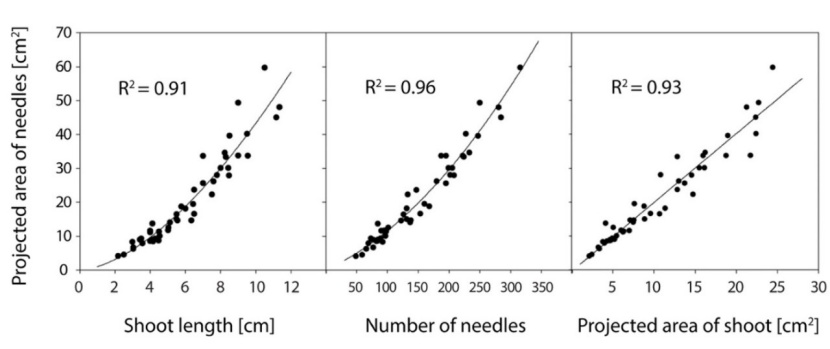
Figure 5: Relationships between projected area of newly grown needles and selected shoot parameters. See Table 4 for the description of the models. / Abbildung 5: Beziehungen zwischen der projizierten Fläche von neu gewachsenen Nadeln und ausgewählter Triebparametern. Tabelle 4 zeigt die Modellparameter.
Specific leaf area (SLA) of needles increased from 28.7 cm2.g-1 on the top of tree to 80.3 cm2.g-1 at the base of crown. Important change occurs in height, with the branches in the lower layers of the canopy being more affected by competition for light than in the upper canopy. In particular, the increase in SLA occurred at a higher rate from 14 m height (62% of stand crown layer) down to 6 m. Furthermore, SLA showed greater variability in the lower parts of the crown than in the upper parts (Fig. 6).
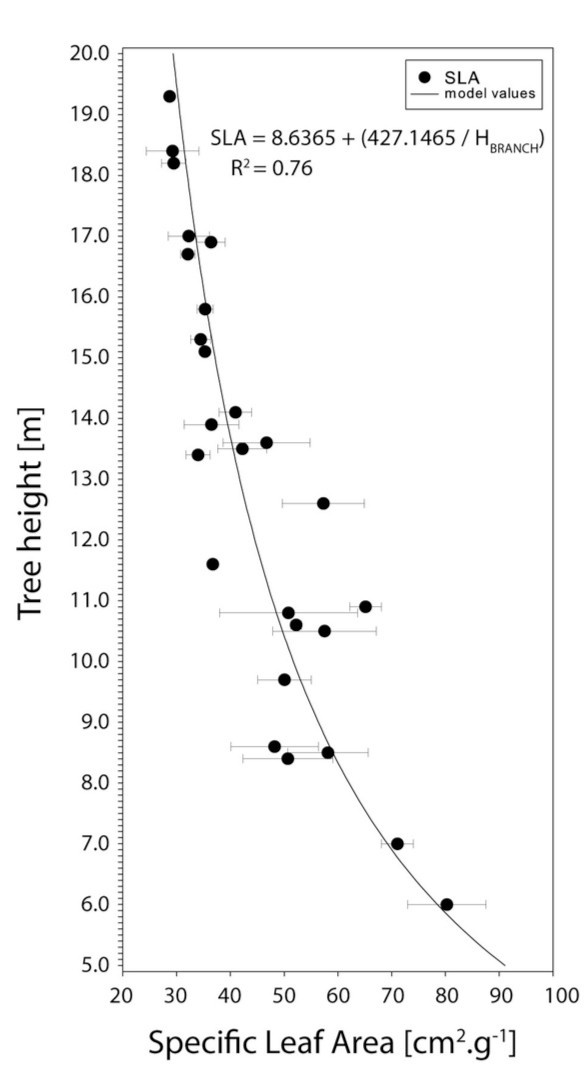
Figure 6: Specific leaf area in different height. Horizontal bars represent standard deviation. See Table 4 for the model description. / Abbildung 6: Spezifische Blattfläche in unterschiedlicher Baumhöhe. Horizontale Fehlerbalken repräsentieren die Standardabweichung. Tabelle 4 zeigt die Modellparameter.
The best correlation was found in the relationship between the projected area of needles (NASHOOT) and the number of needles (NNSHOOT) (R2=0.96). Nevertheless, the estimation of the projected area of newly grown needles was calculated from the shoot length (LSHOOT) because this parameter is more easily measurable (coefficient of determination R2=0.91) – Fig. 5, Table 4.
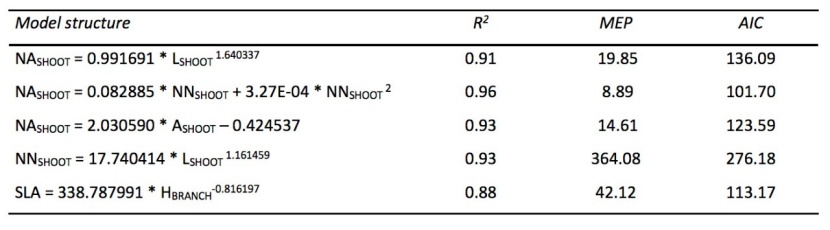
Table 4: Models for relationships displayed in Fig. 4, Fig. 5 and Fig 6. R2 - coefficient of determination, MEP - mean quadratic error of prediction, AIC - Akaike information criterion, NASHOOT - projected area of needles in cm2/shoot, LSHOOT - length of shoot in cm, NNSHOOT - number of needles per shoot, ASHOOT - projected area of shoot in cm2, HBRANCH – height of branch in m. / Tabelle 4: Beschreibung der Modelle, die in Abb. 4, Abb. 5 und Abb. 6 verwendet wurden. R2 - Bestimmtheitsmaß, MEP - mittlerer quadratischer Fehler der Vorhersage, AIC - Akaike Informationskriterium, NASHOOT - projizierte Fläche der Nadeln in cm2/Trieb, LSHOOT - Länge des Triebes in cm, NNSHOOT - Anzahl der Nadeln per Trieb, ASHOOT - projizierte Fläche des Triebes in cm2, HBRANCH – Höhe der Verzweigung in Metern.
The total projected area of newly grown needles on the tree level was calculated from the set of shoot lengths measured on each of the seven studied trees using the parametrized model (Table 4). The projected area of newly grown needles growing between whorls (NATREE_BW) corresponds to roughly one-fifth of the projected area of newly grown needles in whorls (NATREE_IW) for sub-dominant trees and to roughly one-third for dominant trees. The total surface area of newly grown needles of the seven selected trees (Table 5) reached 51 m2.
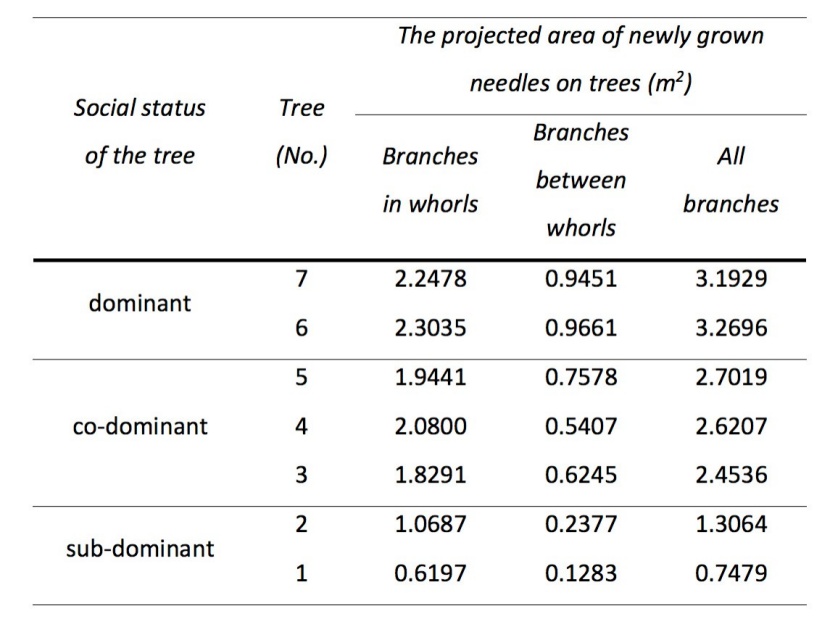
Table 5: The projected area of newly grown needles displayed separately for branches in whorls, branches between whorls and for all branches for the whole living crown. / Tabelle 5: Die Projektionsfläche der neu gewachsenen Nadeln getrennt für Äste in den Quirlen, Ästen zwischen den Quirlen und für alle Äste der lebenden Krone.
Shoots
The inventory of each living branch in whorls and between whorls (Table 6) allowed us to describe the crown architecture of the seven studied trees. The mean LSHOOT was 4.8 cm and the average number of newly grown shoots per tree was 1707.
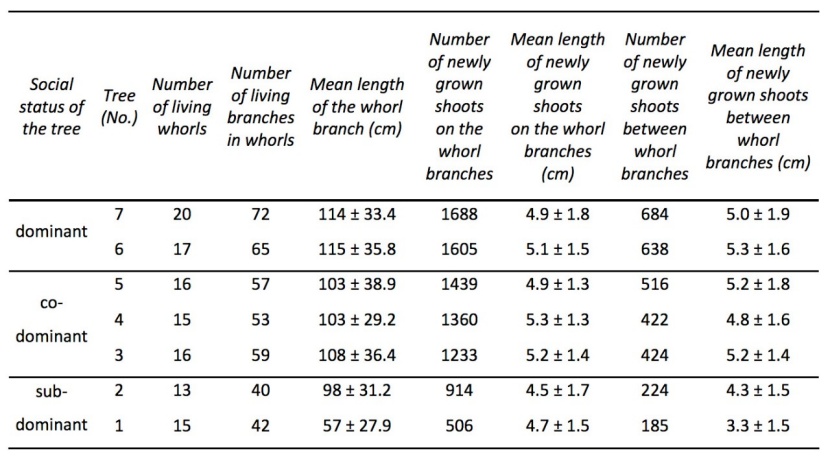
Table 6: Selected biometric characteristics of the branches and newly grown shoots of the seven studied trees. / Tabelle 6: Ausgewählte biometrische Merkmale der Zweige und neu gewachsenen Triebe der sieben untersuchten Bäume.
For each of the seven studied trees, the tree crown was subdivided into five horizontal layers of equal thickness: 0-20%, 21-40%, 41-60%, 61-80% and 81-100% of the vertical tree crown length, starting from the whorl closest to the ground surface that had a minimum of two living branches, and ending with the top of the tree. The mean shoot length was then calculated for each tree crown section. The highest mean length of shoots was observed in the upper sections from 61 to 100% of relative tree crown length in all tree social status groups (Fig. 7.). The highest mean length of shoots was observed in whorls on the top of the crowns (81 – 100% of tree crown length) in co-dominant and sub-dominant trees and the second highest fifth (61 – 80% of tree crown length) in dominant trees. Sub-dominant trees, in contrast with dominant and co-dominant trees, did not produce any new shoots in the lowest living whorls (0 – 20% of tree crown length). There is also noticeable change in slope of newly grown shoot length trend in height 15 m (70 % of stand crown layer). New shoots growing under this height are shorter and the length of shoots decreases faster with decreasing height (Fig. 7).
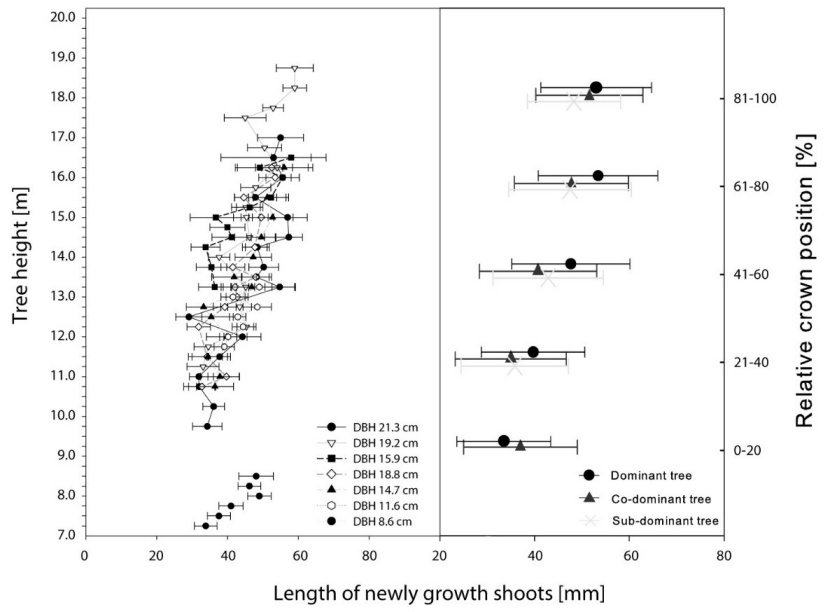
Figure 7: Mean length of newly grown shoots in whorls located at different heights along the tree stem (left). Mean length of newly grown shoots according to the social status of the trees and grouped by relative crown position (right). Horizontal bars represent standard deviation. / Abbildung 7: Die mittlere Länge der neu gewachsenen Triebe in Quirlen entlang der Baumhöhe (links) und die mittlere Länge der neu gewachsenen Triebe gruppiert nach sozialem Status des Baumes und relativer Kronenposition (rechts). Horizontale Fehlerbalken repräsentieren die Standardabweichung.
Tree and stand level
Different models were established using tree height (HTREE), diameter at breast height (DBH), projected area of crown (PACROWN) and crown length (LCROWN) as independent variables to estimate the projected area of newly grown needles (NATREE) of trees (Table 7). These equations were examined separately for branches in whorls, for branches in inter-whorls and for all branches. The best correlations were found in the relationships of NATREE with HTREE (R2 = 0.92), of NATREE with DBH (R2 = 0.90), of NATREE with LCROWN (R2 = 0.90), of NATREE with HTREE and DBH (R2 = 0.96), of NATREE with PACROWN and LCROWN (R2 = 0.82). The relationship between NATREE and PACROWN (R2 = 0.63) demonstrated the lowest correlation. The model with DBH and HTREE (Fig. 8) was chosen to estimate the projected area of newly grown needles on the trees due to its highest accuracy and because these parameters are commonly measured.
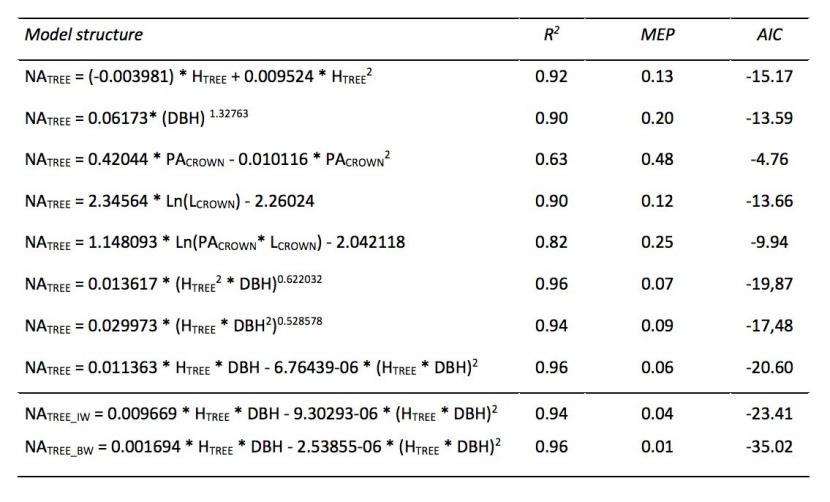
Table 7: Models for estimating the projected area of newly grown needles of trees (NATREE) based on chosen biometric characteristics of selected studied trees. NATREE_IW - estimated projected area of newly grown needles of the branches in whorls, NATREE_BW - estimated projected area of newly grown needles of the branches between whorls. HTREE - tree height (m), DBH - stem diameter at breast height (cm), PACROWN - crown projection area (m2), LCROWN - crown length (m), R2 - coefficient of determination, MEP - mean quadratic error of prediction, AIC - Akaike information criterion. The domains of functions are for HTREE = (4.6;21.0), DBH = (4.4;24.5), PACROWN = (2.0;19.6), LCROWN = (3.1;11.9) / Tabelle 7: Modelle zur Ermittlung der Projektionsfläche von neu gewachsenen Baumnadeln (NATREE) basierend auf ausgewählten biometrischen Merkmalen der untersuchten Bäume. NATREE_IW - geschätzte Projektionsfläche von neu zugewachsenen Nadeln der Zweige in Quirlen, NATREE_BW - geschätzte Projektionsfläche von neu zugewachsenen Nadeln der Zweige zwischen Quirlen. HTREE - Baumhöhe (m), DBH - Stammdurchmesser in der Brusthöhe (cm), PACROWN - Kronenprojektionsfläche (m2), R2 - Bestimmtheitsmaß, MEP - mittlerer quadratischer Fehler der Vorhersage, AIC - Akaike Informationskriterium. Der Anwendungsbereiche der Modelle ist für HTREE 4.6 bis 21.0 m, DBH 4.4 bis 24.5 cm, PACROWN 2.0 bis 19.6 m2 und LCROWN 3.1 bis 11.9m.
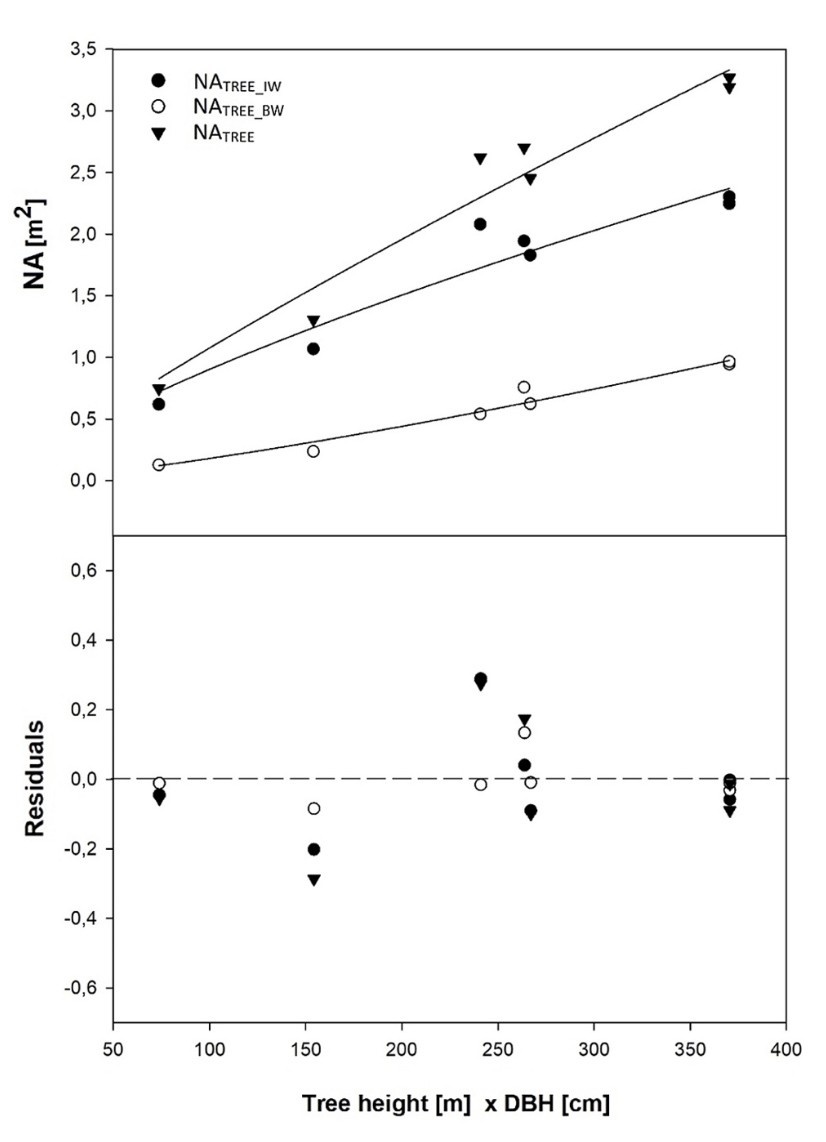
Figure 8: Relationship between the projected area of newly grown needles (NA) and parameter Tree height x DBH (upper) and model residuals (lower). / Abbildung 8: Die Beziehung zwischen der projizierten Fläche der neu gewachsenen Nadeln (NA) und Parameter der Baumhöhe x DBH (oben) und Modellreste (unten).
The DBH and HTREE inventory of all trees in the studied plot was used to estimate the total projected area of newly grown needles of a young spruce stand at the Rájec study site (Fig. 9, Table 7). The total projected area of newly grown needles in 98 trees growing in four sampled plots (à 125 m2) was 4506.7 ± 516 m2 per ha.
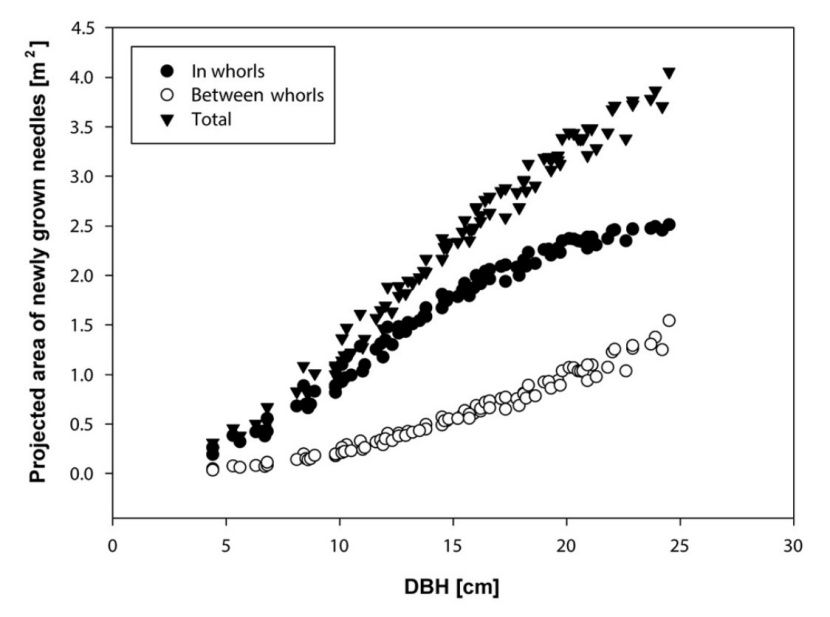
Figure 9: Projected area of newly grown needles of all trees in the experimental plot in 2014 estimated by the model using parameter HTREE x DBH (Table 7). / Abbildung 9: Die projizierte Fläche der neugewachsenen Nadeln der Bäume auf der untersuchten Fläche im Jahre 2014 geschätzt vom Modell mit Parameter von HTREE x DBH (Tabelle 7).
Discussion
This study provides functions for estimation of area of newly grown needles based on simple biometrics parameters of the tree and vertical variability of shoot and needle parameters in the tree crown. The information about newly grown area of needles is valuable, because the area of new needles or new needle biomass is closely associated with production of forest and carbon sequestration.
Needle level
New needle production was at an average of 188 453 needles per tree and strong relationships between the shoot length and the number of needles and between the shoot length and the projected area of newly grown needles were found. Similar results were observed by Sander and Eckstein (2001) for mature Norway spruce. Annual needle production is controlled by genetic and/or ecological factors (Sander and Eckstein 2001). Light availability, as an ecological factor, decreased with the social status of the trees (Kučera et al. 2002). The number of needles per cm of shoot length ranged from 18 to 31, which corresponded with the range of 6 – 63 needles per cm of shoot length presented by Sander and Eckstein (2001) and 13 – 23 needles per cm of shoot length presented by Stenberg et al. (1999). The shoot silhouette to total needle area ratio (STARmax) reported by Palmroth et al. (2002) ranged from 0.116 to 0.251, which compared well with the 0.096 – 0.211 range of STARcal presented in this paper.
Significant changes have been found for SLA and shoot length at relative stand crown layer height 62 % and 70 % respectively. Reich et al. (1998) found out SLA changes in case of light competition which resulted in higher SLA in low light condition and lower SLA in higher light condition. At the lower vertical level of the crown the value of SLA is affected by forest density (i.e. by the shading of neighboring individuals). Equally, the SLA changes are affected by the cumulative leaf area index (LAI) of individuals (Fellner et al. 2016; Konôpka et al. 2016) and by changing light due to various light transmission through the crown layer (Ellsworth and Reich 1993). According to Ellsworth and Reich (1993), the intersection of the curve of cumulative LAI and the light transmission is at 60 % of the crown height. This is consistent with our findings.
Shoot level
The number of newly grown shoots varied between 691 - 2372 (from sub-dominant trees to dominant trees). Norway spruce is able to compensate for a loss of lower crown needle mass by branch and foliage growth in the upper crown (Gilmore and Seymour 1997, Kantola and Mäkelä 2006). The reduction of new shoots and leaf mass is evident in the lower parts in our stand, where no development of newly grown shoots was observed at the base of the crown in sub-dominant trees. This will result in crown shortening and the accumulation of leaf biomass in the upper part of the tree. The greatest length of newly grown shoots was observed in the upper part of tree crown, especially in dominant trees (the greatest length of shoots was achieved at the 61% to 100% relative crown position). The reason for this trend is that trees in the understorey often invest in height growth to avoid shade (Oliver and Larson 1996, Pretzsch 2010). The length of newly grown shoot depends on the position in the canopy and competing environment, which increases the variability in length of newly grown shoots. The highest variability was found at the lower part of crown, where the variability in light intensity and competition are at the highest level. Stand properties such as stand structure, length and size of the branches play a significant role in the development and growth of tree crowns (Deleuze et al. 1996; Lindström 1996) and the thinning regime also has a significant effect on tree crown formation (Pape 1999). Shape and crown development is greatly affected by stand density. If the stand density decreases to the extent that the trees can achieve their maximum crown projection area, the shape of the crown will start to be different (Pretzsch 2010).
Tree and stand level
Many studies indicate that DBH may be an appropriate parameter for estimating total leaf biomass, but there are no published predictions of area of newly grown needles. Marklund (1987), Mund et al. (2002) and Wirth et al. (2004) published allometric relationships between DBH and leaf biomass with significant coefficients of determination (R2 = 0.81, R2 = 0.87 and R2=0.90, respectively). The presented study confirms that a model using DBH as predictor produces good results (R2 = 0.90) when estimating the projected area of newly grown needles in trees (NATREE). The most common measured variable is DBH, while the measured HTREE and other tree variables such as LCROWN and PACROWN are less frequent (Cienciala et al. 2008). The parameters HTREE, LCROWN and PACROWN individually explained 92 %, 90 % and 63 % of the variability in the observed NATREE, respectively. Modelling NATREE using two independent variables as predictors (DBH and HTREE) increased the coefficient of determination from 0.90 (for DBH) and 0.92 (for HTREE) to 0.96 and decreased MEP from 0.64 to 0.57. The importance of additional independent variables was also presented by Černý (1990), Wirth et al. (2004) and Cienciala et al. (2008). LCROWN (as a factor reflecting tree dimension) was found to be a better parameter for estimating area of newly grown needles increment than PACROWN. This was also shown by Krejza et al. (2015), who found similar dependences when they investigated relationships between basal area growth and crown dimension.
Conclusion
The area of newly grown needles is closely connected with basic biometric parameters of the tree. The models have been developed for the prediction of newly grown needles on the basis of a detailed inventory of the newly grown shoots and shoots biometric characteristic of young Norway spruce trees. Values that are relatively easily obtained (DBH, HTREE, LCROWN and PACROWN) were used as input parameters for the model. The created models may be used to calculate the amount of newly grown needles area within the crown layer on the basis of knowledge of the tree height and tree diameter at breast height. Developed models brought the tool for determination of positive component of annual dynamic of leaf area index. The results can be easily combined with specific leaf area and produced valuable information about increment of new needle biomass, which is described as the most productive part of needle biomass.
Acknowledgement
This study was supported by the Specific University Research Found of the FFWD Mendel University in Brno, by project No. 20/2014, by the Ministry of Education, Youth and Sports of CR within the National Sustainability Program I (NPU I) - grant number LO1415 and within grant number COST CZ LD15022 of MEYS of CR and by grant number TJ01000309 of the Technological Agency of the Czech Republic. English language was kindly corrected by the BESTtranslation agency.
Author’s contribution statement
Michal Bellan did the majority of the fieldwork, prepared the application for data analysis, went through the entire mathematical process and prepared the majority of the manuscript. Jan Krejza went through the entire mathematical process, partially helped with fieldwork and contributed to creating the text of the manuscript. Irena Marková contributed to creating the text of the manuscript; all authors contributed substantially to discussions and revisions.
Conflict of interest
The authors declare no conflicts of interest.
References
Beadle C, Long S (1985) Photosynthesis - Is it limiting to biomass production. Biomass 8: 119–168
Bellan M, Světlík J, Krejza J, Rosík J and Marková I (2018) Error of above-ground biomass estimation by using site specific allometric equations on the example of two young spruce stands. Reports of Forestry Research - Zpravy lesnickeho vyzkumu 63(3): 173-183
Bloom AJ, Chapin FS, Mooney HA (1985) Resource limitation in plants-an economic analogy. Annual Review of Ecology and Systematics 16: 363-392
Caudullo G, Tinner W, de Rigo D (2016) Picea abies in Europe: distribution, habitat, usage and threats. In: San-Miguel-Ayanz, J., de Rigo, D., Caudullo, G., Houston Durrant, T., Mauri, A. (Eds.), European Atlas of Forest Tree Species. Publication Office of the European Union, Luxembourg
Cienciala E, Exnerová Z, Schelhaas M-J (2008) Development of forest carbon budget and wood production in the Czech Republic until 2060. Annals of Forest Science 65: 1–10
Čater M (2015) A 20-Year Overview of Quercus robur L. Mortality and Crown Conditions in Slovenia. Forests 6: 581–593
Černý M (1990) Biomass of Picea abies (L.) Karst. in Midwestern Bohemia. Scandinavian Journal of Forest Research 5: 83–95
Deleuze Ch, Hervé J.-Ch, Colin F, Ribeyrolles L (1996) Modelling crown shape of Picea abies: spacing effects. Canadian Journal of Forest Research 26(11): 1957–1966
Echereme Chidi B, Mbaekwe Ebenezer I, Ekwealor Kenneth U (2015) Tree Crown Architecture: Approach to Tree Form, Structure and Performance: A Review - published at: "International Journal of Scientific and Research Publications (IJSRP), Volume 5, Issue 9, September 2015 Edition"
Ellsworth DS, Reich PB (1993) Canopy structure and vertical patterns of photosynthesis and related leaf traits in a deciduous forest. Oecologia 96: 169-178
Fellner H, Dirnberger GF, Sterba H (2016) Specific leaf area of European Larch (Larix decidua Mill.). Trees 30: 1237-1244
Freeland RO (1952) Effect of age of leaves upon the rate of photosynthesis in some conifers. Plant Physiology 27(4): 685–690
Gilmore DW, Seymour RS (1997) Crown architecture of Abies balsamea from four canopy positions in central Maine, USA. Tree Physiology 17: 71–80
Hom JL, Oechel WC (1983) The photosynthetic capacity, nutrient content and nutrient use efficiency of different needle age- classes of black spruce (Picea mariana) found in interior Alaska. Canadian Journal of Forest Research 13: 834 – 839
Homolová L, Lukeš P, Malenovský Z, Lhotáková Z, Kaplan V and Hanuš J (2013) Measurement methods and variability assessment of the Norway spruce total leaf area: implications for remote sensing. Trees 27(1): 111–121
Huttunen S, Heikkilä H (2001) Trends in European Forest Tree Physiology Research: Cost Action E6: EUROSILVA (Vol. 2). Springer Science & Business Media
Kalácska M, Calvo-Alvarado JC, Sanchez-Azofeifa GA (2005) Calibration and assessment of seasonal changes in leaf area index of a tropical dry forest in different stages of succession. Tree Physiology 25: 733–744
Kantola A, Mäkelä A (2006) Development of biomass proportions in Norway spruce (Picea abies [L.] Karst.). Trees 20: 111-121
Kayama M, Kitaoka S, Wang W, Choi D and Koike T (2007) Needle longevity, photosynthetic rate and nitrogen concentration of eight spruce taxa planted in northern Japan. Tree Physiology 27: 1585–1593
Konôpka B, Pajtík J, Marušák R, Bošeľa M and Lukac M (2016) Specific leaf area and leaf area index in developing stands of Fagus sylvatica L. and Picea abies Karst. Forest Ecology and Management 364: 52-59
Krejza J, Světlík J, Pokorný R (2015) Spatially explicit basal area growth of Norway spruce. Trees 9: 1545–1558
Kučera J, Bednářová E, Kamlerová K (2002) Vertical profile of needle biomass and penetration of radiation through the spruce stand. Ekologia (Bratislava) 21(1): 107–121
Linder S (1985) Potential and actual production in Australian forest stands In Landsberg JJ, Parson W (eds.): Research for Forest Management. CSIRO 11–35
Lindström H (1996) Basic density in Norway spruce. Part I. A literature review. Wood and Fiber Science 28(1): 15–27
Marklund LG (1987) Biomass functions for Norway spruce (Picea abies (L.) Karst.) in Sweden (Biomassafunktioner för gran i Sverige). Umeå: Department of Forest Survey, Swedish University of Agricultural Sciences, Report 43, 132
Marková I, Pokorný R (2011) Allometric relationships for dry mass of aboveground organs estimation in young highland Norway spruce stand. Acta Universitatis Agriculturae et Silviculturae Mendelianae Brunensis, LIX(6): 217–224
Marková I, Pokorný R, Marek MV (2011) Transformation of solar radiation in Norway spruce stands into produced biomass − the effect of stand density. Journal of Forest Science 57(6): 233 – 241
Monteith JL (1994) Validity of the correlation between intercepted radiation and biomass. Agricultural and Forest Meteorology 68: 213−220
Mõttus M, Sulev M, Lang M (2006) Estimation of crown volume for a geometric radiation model from detailed measurements of tree structure. Ecological Modelling 198(3-4): 506-514
Mund M, Kummetz E, Hein M, Bauer GA and Schulze ED (2002) Growth and carbon stocks of a spruce forest chronosequence in central Europe. Forest Ecology and Management 171(3): 275–296
Newman K (1979) Sapwood basal area as an estimator of individual tree growth. M.S. thesis, School of Forestry, Oregon State University, Corvallis, Oregon, United States. 65 p.
Niinemets Ü, Kull K (1995) Effects of light availability and tree size on the architecture of assimilative surface in the canopy of Picea abies: variation in needle morphology. Tree Physiology 15: 307–315
Norman JM, Campbell GS (1989) Canopy structure In Pearcy RW, Ehleringer J, Mooney HA, Rundel PW (Eds): Plant Physiological Ecology. Field Methods and Instrumentation. Chapman and Hall, New York: 301−325
Nouvellon Y, Laclau JP, Epron D, Kinana A, Mabiala A, Roupsard O, Bonnefond JM, Le Maire G, Marsden C and Bontemps JD (2010) Within-stand and seasonal variations of specific leaf area in a clonal Eucalyptus plantation in the Republic of Congo. Forest Ecology and Management 259: 1796–1807
Oliver CD, Larson B (1996) Forest Stand Dynamics. John Wiley & Sons Inc, New York, Chichester, Brisbane, Toronto, Singapore, 520 pp
Palmroth S, Stenberg P, Smolander, S, Voipio P and Smolander H (2002) Fertilization has little effect on light-interception efficiency of Picea abies shoots. Tree Physiology 22: 1185−1192
Pangle L, Vose JM, Teskey RO (2009) Radiation use efficiency in adjacent hardwood and pine forests in the southern Appalachians. Forest Ecology and Management 257(3): 1034−1042
Pape R (1999) Influence of thinning on spiral grain in Norway spruce grown on highly productive sites in southern Sweden. Silva Fennica 33(1): 3–12
Pokorný R, Stojnič S (2012) Leaf area index of Norway spruce stands in relation to age and defoliation. Beskydy 5(2): 173–180
Pretzsch H (2010) Forest dynamics, growth and yield. From measurement to model. Springer-Verlag, Berlin, 664 p
Reich PB, Tjoelker MG, Walters MB, Vanderklein DW and Buschena C (1998) Close association of RGR, leaf and root morphology, seed mass and shade tolerance in seedlings of nine boreal tree species grown in high and low light. Functional Ecology 12: 327-338.
Riederer M, Kurbasik K, Steinbrecher R and Voss A (1988) Surface areas, lengths and volumes of Picea abies (L.) Karst. needles: determination, biological variability and effect of environmental factors. Trees 2: 165−172
Sander C, Eckstein D (2001) Foliation of spruce in the Giant Mts. and its coherence with growth and climate over the last 100 years. Annals of Forest Science 58: 155–164
Spiecker H (2003) Silvicultural management in maintaining biodiversity and resistance of forests in Europe—temperate zone. Journal of Environmental Management 67: 55–65
Stenberg P, Linder S, Smolander H (1995) Variation in the ratio of shoot silhouette area to needle area in fertilized and non- fertilized trees of Norway spruce. Tree Physiology 15: 705–712
Stenberg P, Kangas T, Smolander H and Linder S (1999) Shoot structure, canopy openness, and light interception in Norway spruce. Plant, Cell and Environment 22: 1133–1142
Tkemaladze GSh, Makhashvili KA (2016) Climate changes and photosynthesis. Annals of Agrarian Science 14(2): 119-126
Warren CR (2005) Why does photosynthesis decrease with needle age in Pinus pinaster? Trees 20(2): 157–164
Wirth C, Schumacher J, Schulze ED (2004) Generic biomass functions for Norway spruce in central Europe – a meta–analysis approach toward prediction and uncertainty estimation. Tree Physiology 24: 121–139


