Schlüsselbegriffe: Kointegration, Brasilien, Chile, Uruguay, Plantagen, Waldwirtschaft, Ausländische Direktinvestitionen
Abstract
Brazil, Chile and Uruguay have increased pulp exports to international markets. This paper examines the drivers behind the demand dynamics of South American pulp exports to the European Union (EU) that is one of the largest international pulp markets. I used the cointegration bounds testing approach to study the impact of the influencing factors of EU pulp demand from South American countries. The results for Brazil were similar compared to other South American countries and show both high price elasticity of exports and high income elasticity of pulp exports to the EU. Higher plantations yields, higher efficiency in pulp mills, appreciation of the Euro against pulp exporting nations’ currencies and economic growth in the EU member states have caused an increase of exports to the EU. The financial and sovereign debt crisis in Europe has diminished pulp exports from South America to the EU. Fast growing trees plantations might put pressure on the maintenance of the Rainforest and not provide the usual forest protection to the environment and the population. Moreover, an additional environmental disadvantage would be the amount of energy needed for the transportation of pulp exports. The production of biomass on unutilized agricultural land in the EU could reduce this environmental pressure caused by the pulp exports from South America to the EU. Still the produced pulp needs to be competitive on the global markets. This study sheds light on important determinants of competitiveness in the pulp market.
Zusammenfassung
Ausländische Direktinvestitionen (FDI) in Brasilien, Chile und Uruguay haben zu Aufforstungen mit schnellwachsenden Baumarten wie Eucalyptus und auch zur Ausweitung der Produktionskapazitäten für Zellstoff beigetragen. Dies führte zur Erhöhung der Zellstoffexporte, zu Exportüberschüssen, erhöhten Wirtschaftsleistungen und Beschäftigungszuwachs in der Holzindustrie in den genannten Ländern. So haben Brasilien, Chile und Uruguay ihre Zellstoffexporte während der letzten 15 Jahre beinahe verdreifacht. Ziel dieser Studie ist die Untersuchung der treibenden Faktoren des Zellstoffexports aus Südamerika in die Europäische Union (EU), der als einer der wichtigsten Zellstoffmärkte weltweit gilt. Mittels Test auf Kointegration unter Verwendung eines Autoregressiven Distributed Lag-Ansatzes (bounds testing approach) wird geprüft, ob ein Zusammenhang zwischen den erklärenden Variablen und den Zellstoffexporten aus Südamerika in die EU besteht. Die Ergebnisse für Brasilien – der wichtigste Zellstoffproduktions- und Zellstoffexportnation in Südamerika – stimmen mit den Ergebnissen für Rest-Südamerika überein. Diese Studie zeigt eine hohe Zellstoffexportpreis- und Einkommenselastizität. Zunehmende Erträge in schnellwachsende Plantagen, effiziente Zellstoffwerke, Einkommenszuwachs in EU-Mitgliedstaaten und Aufwertung des Euro gegenüber den Währungen der produzierenden Länder tragen zur Erhöhung der Zellstoffexporte aus Südamerika in die EU bei. Die Finanzkrise hatte einen negativen Einfluss auf die Zellstoffexporte aus Südamerika in die EU. Schnellwachsende Baumarten stehen allerdings nicht immer im Einklang mit dem Erhalt des Regenwaldes und die Funktionen des Waldes, die dem Schutz von Menschen und Umwelt dienen. Darüber hinaus erhöht der Transportweg den Aufwand an Energie und ist somit ein zusätzlicher Umweltnachteil. Der Rohstoffanbau in ungenutzten landwirtschaftlichen Flächen innerhalb der EU würde diese negativen Auswirkungen der Zellstoffexporte aus Südamerika auf die Umwelt verringern. Dafür muss aber der in der EU hergestellten Zellstoffoutput auf den globalen Märkten wettbewerbsfähig sein. Die in dieser Untersuchung gewonnenen Erkenntnisse weisen auf die entscheidende Wettbewerbsdeterminante hin.
1. Introduction
Highly export-oriented pulp factories in Brazil, Chile and Uruguay represent almost 95 % of the pulp production and 100 % of pulp exports of South America (FAO 2017). From 2000 to 2015, chemical pulp production and pulp exports in the three countries accounted for 12 % of the global pulp output and one third of global pulp exports. Consequently, on average 61 % of the production was sold in international markets and the exports grew from half of the total output in 2000 to two-thirds in 2015. According to data from Eurostat (https://ec.europa.eu/eurostat/data/database) and FAO (2017) the European Union (EU) is the main destination of these exports, since 40 % of the pulp exports from Brazil, Chile and Uruguay from 2000 to 2015 were sold in the EU.
Increasing exports have been considered a potential solution to boost economic growth and level of income. However, Latin American countries followed an economic strategy based on import-substituting industrialization (ISI) rather than exporting to the global markets (Rozenwurcel, 2006). The unsuccessful results of ISI led countries to replace the ISI model with a market-based development economy, where foreign investments and exports contribute to economic growth and job creation (Williamson, 1990). Foreign investment is certainly important in the development of pulp exports from South America and thus an example for reducing obstacles that keep the economy sectors in the vicious circle of underdevelopment (Hemmer, 2002; Bender, 2007; Lima Toivanen, 2012; Bergen et al., 2013). Pulp exports from Chile, Brazil and since recently Uruguay illustrate the changes in the development strategy that has facilitated investments in pulp mills and fast-growing plantations, mainly Eucalyptus spp.
According to economic theory of international trade, developing countries with a relative large pool of labour and natural resources but a shortage of capital benefit from exports of labour-intensive goods or natural resources. However, the pulp industry in South America shows, that Foreign Direct Investment (FDI) reduce the scarcity of capital in the production processes. The investments have allowed South American countries to export the manufactured pulp (Lima Toivanen, 2012). In other words, through the combination of FDI and natural resource endowments, the level of competitiveness in the international pulp markets increased. But not only capital is important, but also natural resources. Although nowadays natural resources may be not needed nor sufficient to achieve high level of income (exceptions are the discovery of rich oil or gas deposits (Saudi Arabia, Kuwait, Qatar), these countries that have increased their integration into the world economy and have achieved a significant convergence to the level of income of high income countries), natural capital may be helpful to improve competitiveness in specific industries in combination with investments. Multinational companies may also have played an important role in the level of competitiveness of fast-growing trees plantations and pulp mills in the global market. As several scholars have pointed out, multinational companies with access to superior production technology and management know-how produce more efficiently and possess sophisticated (international) marketing networks facilitating exports (Ramstetter, 1999).
Understanding these supply side changes is important in explaining growth of pulp exports. However, the ultimate determinant of exports is the demand in the export markets. Thus this study focusses on the analysis of key determinants of pulp exports from South America. Since the EU market has been the most important destination for pulp exports from South America, our analysis addresses the EU’s demand for pulp from three South American countries (Brazil, Chile, Uruguay). According to previous research on the determinants of exports in the forestry sector, such as Buongiorno et al., (1979), Abiltrup et al., (1999), Kim at al (2003), Kainulainen and Toppinen, (2006), Baek, (2007), Toppinen and Kuuluvainen, (2010), Song et al., (2011), Baek, (2012), Bergen et al., (2013), Kolo and Tzanova, (2017), Kuuluvainen et al., (2018), Nanang, (2010), Cheng et al., (2015), Zhang et al., (2017), Álvarez-Díaz et al., (2018) and the economic theory of market competition and international trade, the determinants of South America’s pulp sales in the EU- Member States market are Consumers` income in the EU, price of the exported pulp in the EU-market as well as price of competitors. The final objective of this work is to quantify the influence of those explanatory factors on the expansion of pulp exports. Latecomer pulp exporters like South America may be a threat for traditional exporters from Europe and North America. Better understanding of the explanatory factors of exports from South America to the EU can be of great assistance for pulp factories and supply chain of pulpwood in the forestry sector. Simultaneously, the estimation of the determinants of exports can be also valuable to understand the role of factors that contribute to increase pulp exports from developing countries. We use time series econometrics (Abildtrup et al., 1999), specifically the ARDL (Autoregressive Distributed Lag) approach to cointegration that has been successfully applied in different fields including forest (Baek, 2012; Alvarez-Diaz et al., 2015; González-Gómez and Bergen, 2015). The structure of this paper is: first, an overview of the evolution of production and exports of pulp in the three countries is given. Second, the data and the model applied are presented, followed by the obtained results. Third, we end with a conclusion and some implications for policy formulation.
2. Pulp production and exports in Brazil, Chile and Uruguay

Figure 1: Development of pulp production in Brazil, Chile, Uruguay and the rest of the world for the period 2000-2015 (values given in tons per year). / Abbildung 1: Zellstoffproduktion in Brasilien, Chile und Uruguay und in den Rest der Welt im Zeitraum 2000-2015 (Werte in Tonnen pro Jahr).
Figure 1 displays the evolution of pulp production in the three main pulp wood-producing nations in South America (FAO, 2017). The three countries are responsible for producing approximately 95 % of the pulp and exporting nearly 100 % of the pulp exports of the subcontinent. Therefore, we will consider the production and exports of Brazil, Chile and Uruguay equivalent to the production and exports of South America. Almost all wood pulp produced and exported is chemical pulp, mainly pulp from Eucalyptus spp. (Bracelpa, 2011; Iba, 2015). Brazil and Chile achieved a noticeable production growth of approximately 100 % from 2000 to 2015. Uruguay started production of bleach eucalyptus kraft pulp in 2007 and has doubled output since them. Simultaneously, the production of pulp of the rest of the world decreased during the same period. Additionally, during the financial crisis, pulp output of the rest of the world dropped by approximately 10 % whereas the three countries of South America only showed a small decrease in output.
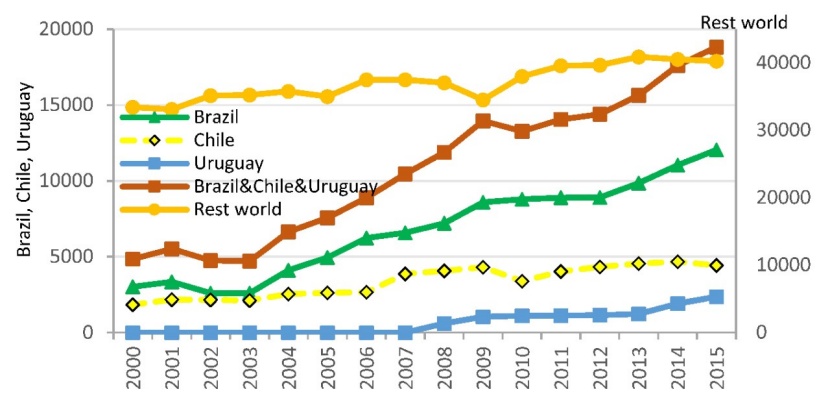
Figure 2: Development pulp exports from Brazil, Chile, Uruguay and the rest of the world for the period 2000-2015 (values given in tons per year). / Abbildung 2: Entwicklung der Zellstoffexporte aus Brasilien, Chile, Uruguay und dem Rest der Welt im Zeitraum 2000-2015 (Werte in Tonnen pro Jahr).
Figure 2 shows the development of the exports from the three countries that nearly quadrupled from 5 million tons in year 2000 to 19 million in 2015. As a consequence of the higher growth rate of exports of South America, its share in the total exports increased from 15 % to 35 % (Figure 2), Brazil expanded its share from 9 % to 22 %, Uruguay from 0 % to 4 % and Chile from 5 % to 9 %.
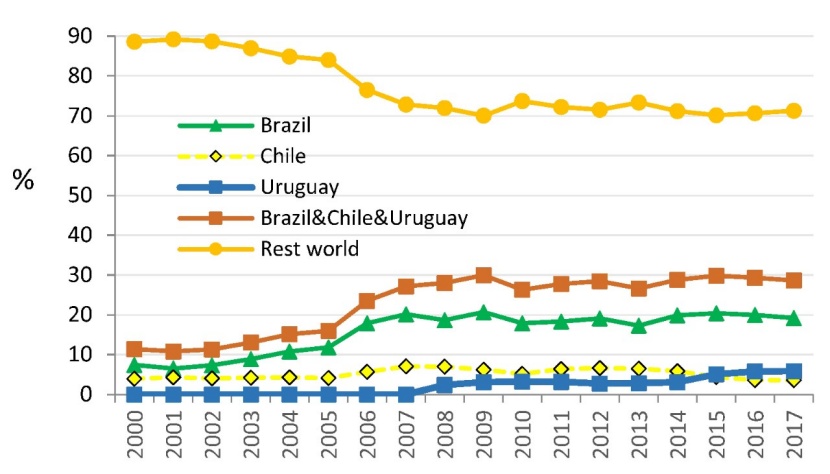
Figure 3: Percentage of pulp exports from South America, Brazil, Chile, Uruguay and the rest of countries in total pulp exports to the EU for the period 2000-2017 (values represent the percentage of tons exported). / Abbildung 3: Anteil der Zellstoffexporte in die EU für Brasilien, Chile, Uruguay und den Rest der Welt im Zeitraum 2000-2015 (Prozentualer Wert der Ausfuhren in Tonnen).
The main export market from 2000 to 2015 was the EU. One quarter of the produced pulp has been exported to the EU market, representing on average 40 % of the three countries’ pulp exports. Whereas the rest of the export countries (including EU member states) increased exports to the EU with an annual growth rate of approximately 1.5 %, South America tripled the pulp exports during the same period. Brazil and Uruguay are the countries responsible for the increase in exports to the EU (Figure 3). Brazil expanded its market share in the EU pulp market from 7 % in the year 2000 to approximately 20 % in 2015 and Uruguay expanded its market share from 0 % in 2006 to 6 % in 2015. On the contrary, the rest of the world (all non-South American nations, including EU member states) exports to the EU-28 market lost nearly 17 percent of their market share, from 88 % in year 2000 to 71 % in 2017.
3. Data and methods
3.1 Data
The study of the main determinants of pulp exports from South America sold in the market of the EU-28 member states, i.e. the explanatory factors of the EU’s demand for South American pulp, is based on the economic theory of market competition and international trade and can be defined as follows:

where Yt is the dependent variable that represents the EU’s imports of pulp (in metric tons) from South America in year t (our analysis is based and the statistics “EU trade since 1988 by CPA 2008 [DS-1060915]“, that follows a statistical classification of products by activity (CPA) as defined by the statistical classification of economic activities in the European Community (NACE). The CPA is part of an integrated system of statistical classifications, developed mainly under the auspices of the United Nations Statistical Division. We have included “pulp”, i.e., code 1711 that contains Chemical wood pulp, dissolving grades (code 17111100), Chemical wood pulp, soda or sulphate, other than dissolving grades (code 17111200), Chemical wood pulp, sulphite, other than dissolving grades (code 17111300) and Mechanical wood pulp; semi-chemical wood pulp; pulps of fibrous cellulosic material other than wood (code17111400)). The data were obtained from the International Trade Statistics available on the Statistical Office of the European Union’s webpage (Eurostat). According to the economic theory of international trade, the explanatory variables are price of pulp (P) of the exporting country (Brazil, Chile, Uruguay) in the export market, income (GDP) in the export market (EU) and price of pulp from other producers (PS), including EU member states in the export market.
First, the price of pulp exports from each export country (Brazil, Chile, Uruguay), P, is obtained by dividing the import value of pulp in Euro of each country (Brazil, Chile, Uruguay) by import quantity of pulp. Both import value in Euro and import quantity were also downloaded from the International Trade Statistics available on the Statistical Office of the European Union’s webpage (Eurostat). The price is expected to be one of the key variables to explain exports, specifically exports to the EU market. If the price of pulp from South America in the EU market increases, the amount of pulp exported will decrease. Researchers have reported (Lima-Tivanen, 2012) a positive impact of FDI on trees plantations yields and on efficiency in pulp mills, which allow the pulp producers to reduce the market price of pulp exports, P, (Mankiw, 2015). It is also worth mentioning that pulp export price, P, is not only determined by the export price in the export country’s currency but also by the exchange rate fluctuations between the export country’s currency (Brazil, Chile and Uruguay) and the euro (Vesala, 1992; Hänninen and Toppinen, 1999; Kim at al., 2003; Baek, 2007).
The second key explanatory variable of demand is income in the export market, i.e. the GDP of the European Union Member States. The data were obtained for the EU-28 member states from the webpage of the Statistical Office of the European Union (Eurostat). It is expected that higher levels of income in the EU countries lead to higher demand for pulp, including pulp imports from South America. PS is the price of substitute pulp, produced in competitor countries. Nearly all the pulp exported to the EU from South America is eucalyptus pulp. The main exporting countries of eucalyptus pulp exports to the EU are Brazil, Chile, Portugal, Spain and Uruguay. Consequently, we consider Portugal and Spain the competitors of South American exports and the rest of South American countries competitors for each of them, e.g. the competitors for Brazil will be Chile, Uruguay, Portugal and Spain. If the pulp price from competitors in the EU pulp market increases, it raises the exports from South America. On the contrary, a competitor’s pulp price decrease reduces exports from South America in the EU pulp market. PS for each competitor country is obtained by dividing the import value of pulp in Euro of each competitor by import quantity of pulp. Both import value in Euro and import quantity were downloaded from the International Trade Statistics available on the Statistical Office of the European Union’s webpage (Eurostat). We have included the dummy variable CRISIS that takes value one for the period 2008:1-2009:2 (European Commission, 2017). εt is the disturbance term, which is assumed to be an independent and identically distributed random variable. We analyse separately the main export country Brazil. The study is based on quarterly 72 observations for the period 2000:1 to 2017:4.
3.2 Methodology
The quantification of the response of South American pulp exports to changes in the explanatory variables specified in equation (1) includes different stages: in the first stage, we determine the order of integration of the variables; in the second stage, we carry out a cointegration analysis; in the third stage, we estimate the error correction model (ECM); in the fourth stage, we quantify the effects of the explanatory variables on the pulp exports.
3.2.1 Testing the order of integration of the variables
It is of paramount importance to determine the order of integration of the variables. In the case of stationary variables, the standard statistical methods could be used. In the case of non-stationary variables, cointegration techniques such as those developed by Engle and Granger (1987), Johansen and Juselius (1990), Phillips and Ouliaris (1990) or Pesaran et al. (2001) are applicable. However, Engle and Granger (1987), Johansen and Juselius (1990), Phillips and Ouliaris (1990) show an important restriction since they can be applied only when the variables are integrated of the same order. The ARDL bounds testing approach to cointegration (Pesaran et al., 2001) is applicable regardless of whether the variables are integrated of order zero I(0), of order one I(1) or both. The KPSS (Kwatkowski-Phillips-Schmidt-Shin) tests is used for testing the order of integration of the variables (Kwatkowski et al., 1992).
3.2.2 Cointegration analysis
The ARDL bounds testing approach to cointegration is based on two tests. The procedure implies estimating the following error correction model (ECM) associated with equation (1) and represented in equation (2):

To study the relationship between the demand and the vector of explanatory variables defined in equation (1),where Δ is the first-difference operator; αj and δij reflect the short-term dynamics of the analysis; ф and ϑi are the parameters that represent the long-term relationship; γ describes the effect of the financial crisis of 2008; the subscript j in αj and δij denotes each lag considered in the short-run dynamics. p is the lag length and we assume a maximum number of lags p = 4. The subscript i in δij and ϑi refers to the each of the explanatory variables included in the model. Y1 measures the EU’s imports of pulp (in metric tons) from South America in year t, GDP is the European Union member states’ real gross domestic product, P is price of pulp exports from each export country and PS is the pulp export price of other main export nations of eucalyptus pulp to the EU.
The ARDL bounds testing approach starts with the estimation of the models represented by equation (2) using ordinary least squares (OLS). The approach is based on two tests to check the null hypothesis that the variables are not cointegrated (Pesaran et al., 2001). The first test is an F-statistic to test the joint nullity of all long-term regression coefficients H0 : ф = ϑ1 = ϑ2 = ϑ3 = 0. The second statistic is a t-test that checks the nullity of the parameter associated with the lagged dependent variable (H0 : ф = 0). Pesaran et al., (2001) proposed upper and lower critical value bounds for multiple scenarios. The calculated F and t statistics have to be compared with the upper and lower critical value bounds. It allows us to determine statistically the acceptance or rejection of the null hypothesis. If the statistics of the tests are above the upper critical value of the bound, we reject the null hypothesis and have evidence of a relationship. On the contrary, if the statistics are below the critical lower value of the bound, we cannot reject the null hypothesis of no cointegration and cannot confirm the existence of a relationship between the variables. If the test values are between the upper and lower critical bounds, the inference is inconclusive.
3.2.3 Estimation of the pulp demand from South America to the EU
If a long-run relationship is verified using the ARDL bounds testing approach to cointegration, the ECM allows us to estimate the effects of the explanatory variables on the exports. The estimated coefficients of equation (2) provide the variables that explain exports and the sign of the effects of these explanatory variables. However, these estimated parameters are valid if and only if the estimated ECM satisfied certain requirements, i.e., the estimated coefficients must be statistically different from zero; they must have the expected signs according to economic theory of market competition and international trade; the estimated ECMs must not exhibit any problem of heteroscedasticity, autocorrelation or misspecification.
3.2.4 Elasticities
The estimated coefficients (2) do not quantify the impact of the explanatory variables on pulp exports. To quantify the long-term impact of these explanatory factors on the exports, the next step is to calculate the point estimates of the elasticities according to the following expression (Bardsen, 1989):
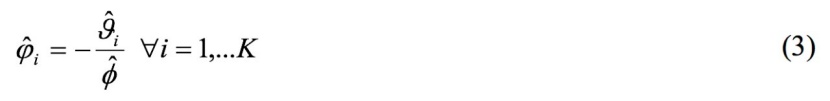
where ̂ϑi and ̂φ are the estimated long-run coefficients in equation (2).
4. Results
4.1 Results of the test of the order of integration of the variables
The results of the KPSS test are reported in table 1. Different degrees of integration of the time series have been identified, and none of the variables is I (2). The export price of pulp wood is integrated into order one I (1), and the other variables are stationary at level I (0). Therefore, we cannot use techniques of cointegration analysis developed by Engle and Granger (1987), Johansen and Juselius (1990) or Phillips and Ouliaris (1990), but because no variable is integrated into order two I (2), the ARDL bounds testing approach to cointegration is applicable (Pesaran et al., 2001).
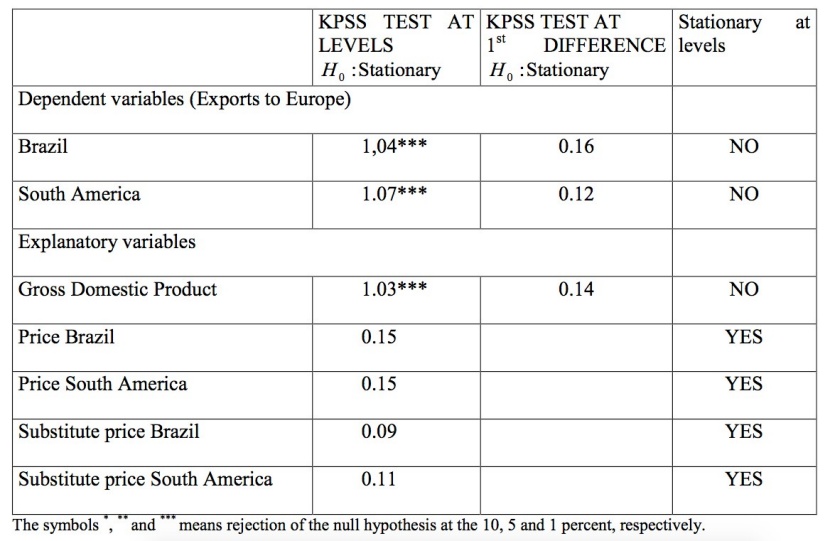
Table 1: Results of KPSS (Kwiatkowski-Phillips-Schmidt-Shin) test of stationarity. / Tabelle 1: KPSS Test auf Stationarität.
4.2 Results of the Cointegration analysis
Table 2 displays the corresponding critical value bounds (Pesaran et al, 2001) and the computed statistics, which are FI =8.45 (|tI |= 3.63) for South America and FI =10.37 (|tI |= 4.18) for Brazil. The F-statistic and t-statistic for South America and Brazil are above their respective upper critical value bounds; therefore, we can reject the null hypotheses of no cointegration and confirm a long-term relationship between pulp exports to the EU and the vector of explanatory variables GDP, P, PS and CRISIS.
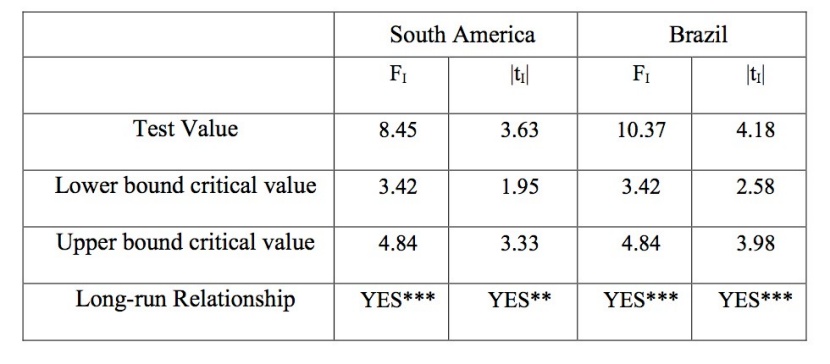
Table 2: Critical Values and test values for Cointegration. ARDL Test. / Tabelle 2: Kritische Werte und Test Werte für den ARDL (Autoregressive distributed lag) Test auf Kointegration.
4.3 Results of the estimation of the pulp demand from South America to the EU
The estimates of the ECM specified in equation (2) for South America and Brazil separately are given in Table 3. The negative sign of the coefficients ̂ϑ1 and the positive signs of the coefficients ̂ϑ2 and ̂ϑ3 are consistent with the economic theory of market competition and international trade. Moreover, all the coefficients are significant and therefore statistically relevant to explain the exports for Brazil and ̂ϑ1, ̂ϑ2 for South America. Income growth in the EU member states will lead to pulp export increases from South America and Brazil. On the contrary, if the price of pulp exports from South America or from Brazil in the EU market increases, it causes a reduction of their exports to the EU. Finally, if prices from the main competitors (Chile, Uruguay, Portugal, Spain) decline, Brazil reduces its exports to the EU.
Table 3 also provides diagnostic tests on the final ECMs. As we can see, the estimated models have a relatively high goodness of fit (Adjusted-R2 = 0.48 for South America and Adjusted-R2 = 0.46 for Brazil), and none of the estimates exhibit any problems of autocorrelation, heteroscedasticity or misspecification. As a result, we can affirm that the regression residuals behave statistically as white noise processes in both cases. Those tests prove the econometric strength of our estimations.
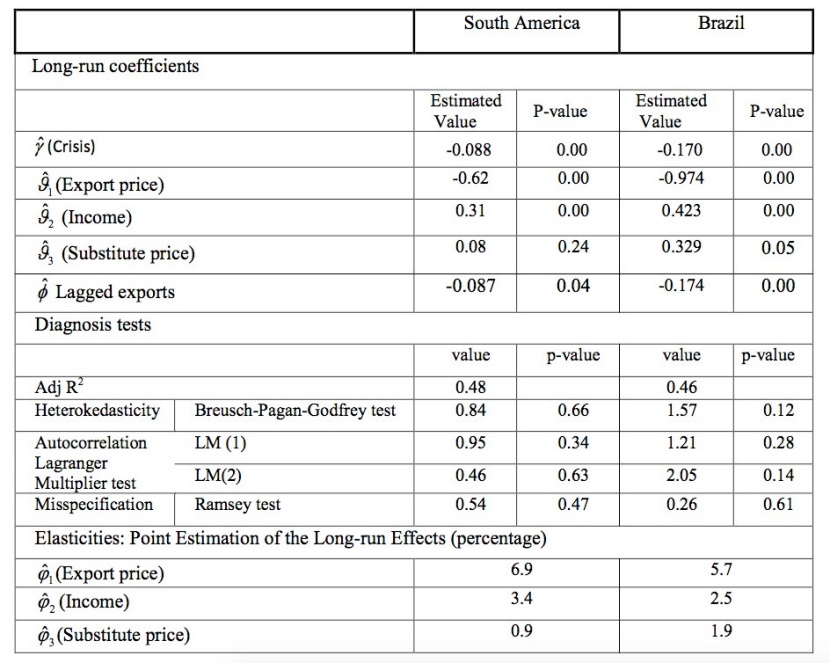
Table 3: Long-run coefficients, diagnosis tests and elasticities. / Tabelle 3: Langfristige Parameter, diagnostische Tests und Elastizitäten.
4.4 Elasticities
Table 3 also reports the estimates of the impact of the explanatory variables on pulp exports (Bardsen, 1989) or elasticities. The estimated price elasticity of pulp exports ̂φ1 shows a strong influence of price on the long-run dynamic of pulp exports. A 1 % price decrease of South American pulp exports in the EU market reduces the demand for pulp from South America by 6.9 %. Considering separately the exports from Brazil to the EU, the price elasticity is also very high at 5.7 %. It reflects the strong effects of price changes on pulp exports to the EU. Two facts are worth mentioning.
First, efficiency improvements in pulp mills or trees plantations associated with FDI allow pulp producers to reduce the market price. Due to the estimated high price elasticity of 6.9 % for South America and 5.7 % for Brazil, every price decrease in the export price of pulp strong positive effects on pulp exports from South America in the EU market that may substitute pulp from other countries, including EU-28 member states and North America.
Second, behind the price of pulp exports from South America in the EU market is not only the price in the exports country`s currency (Chilean and Uruguayan Pesos and Brazilian Real) but also the exchange rate between the exports country`s currency and the Euro. The Euro has shown an appreciation against the three South American pulp exporting nations currencies (Pacific Exchange Rate Service, http://fx.sauder.ubc.ca/), which reduced the price of pulp exports from South America in the EU market. Again, the estimated high price elasticity, of 6.9 % for South America and 5.7 % for Brazil, implies that the appreciation of the Euro will also show a positive impact on sales in the EU market.
The estimated income elasticity of pulp exports, ̂φ2, shows that a 1 % increase in income in the EU member states raises pulp demand by 3.4 % and 2.5 % from South America and Brazil, respectively. The high-income elasticity of exports will allow export countries to increase exports to the EU in case of GDP growth in the EU member states. The estimated substitute price elasticity of pulp exports for Brazil, ̂φ3, implies that a 1 % reduction in the price of pulp exports from main competitors reduces Brazil’s pulp exports to the EU market by 1.9 %. Finally, the last variable shows that during the global financial crisis and European sovereign debt crisis (European Commission, 2017), EU’s demand for South American pulp dropped 8.7 %, and the EU’s demand for Brazilian pulp dropped even more (17 %).
5. Discussion and conclusions
We have analysed the explanatory factors of exports from South American pulp producers to the EU. The objective was to identify exports’ driving forces. Even though we focus on the demand side, the importance of changes in the supply side or production processes in South American countries for the evolution of pulp exports to the global market and specifically to the EU market is undeniable. Supply-side changes are associated with investments in plantations of fast-growing trees and pulp mills and affect the price of pulp exports included in our analysis (Lima-Tovainen, 2012; Álvarez-Díaz et al., 2018). The connection between the forestry sector in South America and the international markets is strong, so pulp exports have increased in absolute and relative terms.
Scholars have pointed out that foreign investments (FDI) and exports have contributed to ameliorate the obstacles that keep the sectors of the economy in a vicious circle of underdevelopment characterized by low employment, low productivity, low income, low saving and low investment (Hemmer, 2002; Bender, 2007; Bergen et al., 2013). The growing openness of South American economies has affected international trade and capital flows, first in Chile and later in Brazil and Uruguay. The economic strategy based on import-substituting industrialization (ISI) (Rozenwurcel, 2006) was replaced by a progressive liberalization of trade (reducing import tariffs) and reduction of external restrictions on inward FDI (Williamson, 1990), particularly in Brazil’s, Chile’s and Uruguay’s forestry sectors (Lima-Tovainen, 2012). The increasing FDI in fast-growing-tree plantations and pulp mills has increased efficiency; consequently, the competitiveness in the international pulp markets triggered the export boom. On the other hand, multinational companies played an important role because FDI in the forestry sector was carried out mainly by international enterprises. Their advantages include access to superior production technology and management know-how, more efficient production and sophisticated international marketing networks that facilitate exporting (Ramstetter, 1999). However, explanatory factors of the EU’s demand for pulp from South America ultimately determine the South American pulp exports to the EU, which is why we have focused on demand.
We have found conclusive statistical evidence that confirms our expectations based on the economic theory of international trade and the results obtained in previous empirical studies on trade. Pulp exports to the main export market (European Union) are sensitive to income, pulp export price and competitor countries’ pulp export prices. First, results show that pulp export prices from South America and Brazil have strong effects on their pulp exports to the EU. It means that a productivity increase (higher plantations yields and/or higher efficiency in pulp mills) or appreciation of the Euro against pulp exporting nations’ currencies that causes a decrease in the price of pulp exports from South America in the EU market, results in an increase of these exports to the EU market.
Second, the income elasticity of exports lets us affirm that total pulp exports from South America and from Brazil to the EU will increase as a response to GDP growth in the EU member states. Third, changes in the pulp export price from competitor nations affect pulp exports from Brazil to the EU. Finally the financial and sovereign debt crisis in Europe has caused a reduction in the EU demand for pulp from South America and Brazil.
To the authors’ knowledge, this study is the first attempt to analyse the explanatory factors of pulp exports from the three South American countries Brazil, Chile and Uruguay to a specific export market using cointegration techniques to avoid problems of spurious regressions and non-stationary time series. The results are similar considering the total pulp exports from South America or considering separately that Brazil is responsible for nearly two-thirds of the subcontinent’s pulp production and pulp exports. During the study period the intra EU-28 trade of pulp increased in absolute and relative terms and it represents the main flow of exports to the EU-28 pulp market. Consequently, the higher exports of pulp from South America into the EU-28 market did not substitute EU exports. On the contrary, exports of pulp to the EU-28 from Canada and the United States show a decrease that implies a decline in the EU pulp market share from around one third of the pulp exports to the EU in year 2000 to 8 % in year 2016. These changes in the market should put pulp factories and its supply chain of pulpwood in Europe on alert. Therefore, pulp mills, forestry sector and the government agencies should be particularly aware of the high price elasticity of pulp exports and the main factors that are responsible for the decline in the price of exports of pulp of competing countries, i.e., investments in new factories, higher plantations yields or national currency’s depreciation against the Euro.
Acknowledgements
The author thanks the sabbatical year granted by his employer that gave him the opportunity to devote full time to research.
References
Abildtrup J, Helles F, Holten-Andersen P, Larsen J, Thorsen B, 1999. Modern Time Series Analysis in Forest Products Markets. Kluwer Academic Publishers, Dordrecht. 217 pp.
Álvarez-Díaz M, González-Gómez M, Otero-Giráldez MS, 2015. Detecting the socieconomic driving forces of the fire catastrophy in NW Spain. Eur J Forest Res 134 (6): 1084-1097.
Álvarez-Díaz M, González-Gómez M, Otero-Giráldez MS, 2018. Main determinants of export-oriented bleached eucalyptus kraft pulp (BEKP) demand from the north-western regions of Spain. Forest Policy and Economics 96: 112-119.
Baek J, 2007. The J-curve effects and the US-Canada forest products trade. Journal of Forest Economics 13: 245-258.
Baek J, 2012. The long-run determinants of US timber imported from Canada. Forest Policy and Economics 14: 69-73.
Bardsen G, 1989. Estimation of long run coefficients in error correction models. Oxford Bulletin of Economics and Statistics 51(3): 345-350.
Bender D, (2007) Aussenhandel. Band 1, Beitrag 1. In Vahlens Kompedium der Wirtschaftstheorie und Wirtschaftspolitik: Apolte T, Bender D, Berg H, , Cassel D, Erlei M, Grossekettler H, Hartwig KH, Hübl L, Kerber W, Nienhaus V, Ott N, Siebke J, Smeets HD, Thieme J, Vollmer U (eds). 7. überarbeitete und erweiterte Auflage, Vahlen Verlag, München. 737 pp.
Bergen V, Löwenstein W, Olschewski R, 2013. Forstökonomie. Ansätze für eine vernünftige Umwelt- und Landnutzung. 2. überarbeitete und erweiterte Auflage, Vahlen Verlag. München. 469 pp.
Bracelpa, 2011. Relatório Florestal 2010-2011. Associaçao Brasileira de Celulosa e Papel.
Buongiorno J, Chou J, Stone RN, 1979. A monthly model of the U.S. demand for softwood lumber imports. Forest Science 25:641–655.
Davidson R, Mackinnon JG, 2004. Econometric theory and methods. Oxford University Press, Oxford. 768 pp.
Engle RF, Granger CWJ, 1987. Cointegration and Error Correction: Representation, Estimation and Testing. Econometrica 55, 251-76.
European Commission. 2017. Reflection paper on the deeping of the Economic and Monetary Union. COM(2017) 291 of 31 May 2017.
FAO, 2017. FAO yearbook of forest products 2015. FAO statistics. Rome. Accessed date: 20 Juny 2018 (dataset).
González-Gómez M, Bergen V, 2015. Berücksichtigung der Nichtstationarität von Zeitreihen bei empirischen Untersuchungen des deutschen Rohholzmarktes. Allgemeine Forst- und Jagdzeitung 186 (3/4): 53-62.
Hänninen R, Toppinen A, 1999. Long-run price effects of exchange rate changes in Finnish pulp and paper exports. Applied Economics 31: 947-956.
Hemmer HR, 2002. Wirtschaftsprobleme der Entwicklungsländer. 3. neubearbeitete und erweitere Auflage, Vahlens Handbücher der Wirtschafts- und Sozialwissenschaften, München. 168 pp.
Iba, 2015. Indústria brasileira de árvores. Report 2015. Available at http://iba.org/images/shared/iba_2015.pdf
Johansen S, Juselius K, 1990. “Maximun Likelihood Estimation and Inference on Cointegration with Applications to the Demand for Money”. Oxford Bulletin of Economics and Statistics, vol. 52, pp. 169-210.
Kainulainen T, Toppinen A, 2006. Testing integration in main European paper markets under floating and fixed exchange rates. Forest Policy and Economics, 9(4), 372-379.
Kim DJ, Schreude GF, Youn YC, 2003. Impacts of the currency value change on the forest products import quantities in Korea. Forest Policy and Economics 5(3): 317-324.
Kolo H, Tzanova P, 2017. Forecasting the German forest products trade: A vector error correction model. Journal of Forest Economics 26: 30-45.
Kuuluvainen J, Korhonen J, Xu D, Toppinen A, 2018. Price integration for domestic and imported sawlogs and pulpwood in Finland: an update. Scandinavian Journal of Forest Research 33(1): 71-80.
Kwiatkowski D, Phillips PCB, Schmidt P, ShinY, 1992. Testing the null hypothesis of stationarity against the alternative of a unit root: How sure are we that economic time series have a unit root?. Journal of Econometrics, 54(1-3), 159-178.
Lima-Toivanen MB, (2012) The South American Pulp and Paper industry: The cases Brazil, Chile, and Uruguay. In The Evolution of Global Paper Industry 1800¬–2050. A comparative Analysis; Lamberg, JA, Ojala J, Peltoniemi M, Särkkä T (eds). pp: 243-283. Springer, Dordrecht.
Mankiw NG, 2015. Principles of Economics. 7th Edition. Cengage Learning. Stamford, USA. 849 pp.
Nanang DM, 2010. Analysis of export demand for Ghana’s timber products: A multivariate. co-integration approach. Journal of Forest Economics 16: 47-61.
Pesaran M, Shin Y, Smith R, (2001). Bounds testing approaches to the analysis of level relationships. Journal of Applied Econometrics 16: 289-326.
Phillips PC, Ouliaris S, 1990. Asymptotic properties of residual based tests for cointegration. Journal of the Econometric Society 58(1): 165-193.
Ramstetter E, 1999 Comparisons of Foreign Multinationals and Local Firms in Asian Manufacturing over Time. Asian Economic Journal 13(2):163-203.
Rozenwurcel G, (2006) Why Have All Development Strategies Failed in Latin America? Research Paper No. 2006/12. World Institut for Development Economic Research –WIDER. United Nations University-UNU.
Song N, Chang SJ, Aguilar F X, 2011. US softwood lumber demand and supply estimation using cointegration in dynamic equations. Journal of Forest Economics, 17(1), 19-33.
Pacific Exchange Rate Service The University of British Columbia.. http://fx.sauder.ubc.ca/
Toppinen A, Kuuluvainen J, 2010. Forest sector modelling in Europe—the state of the art and future research directions. Forest Policy and Economics 12 (1): 2-8.
Vesala J, 1992. Incomplete exchange rate pass-through and hysteresis in trade. A survey of recent theories and empirical study of export pricing of Finnish paper manufactures. Bank of Finland. Discussion Papers 29/1992.
Williamson J, (1990). ‘What Washington means by policy reform’, in J. Williamson, (ed.) Latin American Adjustment: How Much Has Happened? Institute for International Economics: Washington DC.
Zhang H, Kuuluvainen J, Lin Y, Gao P, Yang H, 2017. Cointegration in China’s log import demand: price endogeneity and structural change. Journal of Forest Economics 27: 99-109.


