Schlüsselbegriffe: Schlitzfalle, Trichterfalle, Kreuzbarrierenfalle, Beifang, Ips typographus, Überwachung, Budget, Großer Achtzähniger Fichtenborkenkäfer, Nemosoma elongatum, Thanasimus femoralis, Thanasimus formicarius
Abstract
In most European countries, traps play an important role in Ips typographus monitoring, early warning system for predicting future outbreaks and for decision making which approach is best to repair the damage. However, to make a good monitoring system, the most effective trap type should be used. We investigated the effectiveness of traps in catching I. typographus, their selectivity towards bycatch and towards 3 selected predators (Nemosoma elongatum, Thanasimus femoralis and Thanasimus formicarius), and the cost of using 5 different types of traps: single slot, double slot, triple slot, cross-vane and funnel traps. We investigated the difference between alternative traps (single slot, cross-vane and funnel traps) and separately between different types of slot traps (single, double and triple slot traps). We also tested whether we could sense the difference in I. typographus abundance in the locations where the natural disturbance happened in the same year as the experiment took place (tested location), compared to the undisturbed locations (control location). Altogether, we used 50 traps, where every trap type had five repetitions per treatment (undisturbed/disturbed area) and was baited with the pheromone IT Ecolure Extra®. We collected the catch from mid-April until the end of September 2020. We found that the single slot, cross-vane and funnel traps did not differ in their effectiveness and selectivity towards bycatch. The most affordable trap type is the funnel trap, followed by the cross-vane and slot traps. The results for all slot traps showed that the catch of I. typographus increases from single, through double to triple slot traps. The same pattern was to some extent observed in the bycatch and selected predators. While the number of caught I. typographus, almost doubled form single to triple slot trap, the trap expenses tripled. Among the alternative traps, the highest score in the index of effectiveness was obtained by the single slot trap. Among all three slot traps, the triple slot trap had the highest score in the index of effectiveness, closely followed by the single slot trap. Even though the cost of traps is lower compared to the cost of labour, it can still play an important role when deciding which trap type is the best choice for monitoring, risk reduction measure or research.
Zusammenfassung
In den meisten europäischen Ländern spielen Fallen eine wichtige Rolle bei der Überwachung von Ips typographus, beim Frühwarnsystem zur Vorhersage künftiger Ausbrüche und bei der Entscheidung, welches Vorgehen zur Behebung von Schäden am besten geeignet ist. Für ein gutes Überwachungssystem sollte jedoch der effektivste Fallentyp verwendet werden. Wir haben die Wirksamkeit von Fallen beim Fang von I. typographus, ihre Selektivität gegenüber Beifang und 3 ausgewählten Prädatoren (Nemosoma elongatum, Thanasimus femoralis und Thanasimus formicarius) sowie die Kosten für den Einsatz von 5 verschiedenen Fallentypen – Einfach-Schlitz-, Doppel-Schlitz-, Dreifach-Schlitz-, Kreuzbarrieren- und Trichterfallen – untersucht. Wir haben den Unterschied zwischen alternativen Fallen (Einfach-Schlitz-, Kreuzbarrieren- und Trichterfallen) und zwischen verschiedenen Arten von Schlitzfallen (Einfach-, Zweifach- und Dreifachfallen) untersucht. Wir haben auch getestet, ob wir einen Unterschied in der Abundanz von I. typographus zwischen den Orten feststellen konnten, an denen im selben Jahr, in dem der Versuch stattfand, eine Störung auftrat (getesteter Ort) und den Orten ohne Störung (Kontrollort). Insgesamt haben wir 50 Fallen verwendet, wobei jeder Fallentyp 5 x pro Bereich (Bereich ohne/mit Störung) eingesetzt wurde und mit einem Köder mit Pheromon IT Ecolure Extra® versehen war. Wir haben die Fänge von Mitte April bis Ende September 2020 gesammelt. Die Einfach-Schlitz-, Kreuzbarrieren- und Trichterfallen unterschieden sich nicht in ihrer Wirksamkeit und Selektivität in Bezug auf den Beifang. Der günstigste Fallentyp ist die Trichterfalle, gefolgt von der Kreuzbarrieren- und der Schlitzfalle. Die Ergebnisse für alle Schlitzfallen haben gezeigt, dass der Fang von I. typographus von der Einfach- über die Zweifach- bis zur Dreifach-Schlitzfalle zunimmt. Dasselbe Muster wurde in gewissem Umfang bei Beifängen und Prädatoren beobachtet. Während sich die Anzahl von gefangenen I. typographus von der Einfach- zur Dreifach-Schlitzfalle fast verdoppelte, verdreifachten sich die Fallenkosten. Von den alternativen Fallen hat die Einfach-Schlitzfalle die höchste Punktzahl auf dem Wirksamkeitsindex erreicht. Von allen drei Schlitzfallen hat die Dreifach-Schlitzfalle die höchste Punktzahl auf dem Wirksamkeitsindex erreicht, dicht gefolgt von der Einfach-Schlitzfalle. Auch wenn die Kosten für Fallen im Vergleich zu den Arbeitskosten geringer sind, können sie doch eine wichtige Rolle bei der Entscheidung spielen, welcher Fallentyp die beste Wahl für die Überwachung, Risikominderung oder Forschung ist.
1 Introduction
In the last decades, European forests have been threatened by climate change and subsequent pest outbreaks (Forest Europe 2020). One of the most problematic pests in Central Europe is the European spruce bark beetle (Ips typographus [Linnaeus, 1758]) (Hlásny et al. 2019, Nagel et al. 2017). This species attacks Norway spruce (Picea abies), which is one of the most economically important tree species in Europe (Forest Europe 2020). Calculations have shown that the damage caused by I. typographus in European countries is estimated at 2.88 million m3 per year between 1958 and 2001 (Grégoire et al. 2015). It is therefore important to have a good working management system in place which focuses on monitoring, early warning and the actual mitigation of outbreaks (Fettig and Hilszczański 2015).
Monitoring of forest pest populations shows whether the dormant population will grow and cause significant outbreaks and subsequently considerable damage to host trees (Wermelinger 2004). When populations are increasing, foresters have to act quickly in order to mitigate outbreaks (Fettig and Hilszczański 2015). However, population growth can be very rapid; therefore, methods that can accurately measure it should be used (Fernandez-Carrillo et al. 2020, Fettig and Hilszczański 2015, Wermelinger 2004). Several methods are used for monitoring bark beetle populations or the onset of damage, varying from remote sensing with satellites or drones (Fernandez-Carrillo et al. 2020) to assessing trees in the field (Fettig and Hilszczański 2015). However, the most common method for I. typographus is the use of pheromone traps (Wermelinger 2004). This method has been proven to be very effective since it shows the swarming of the beetles over time and based on data collected from the past year, we can use phenological models to estimate where the next outbreak will occur (Baier et al. 2007). However, when using trap monitoring, several critical points should be taken into account:
(i) traps should be set at or before the start of bark beetle swarming,
(ii) pheromones should work well enough to detect an increase in the pest population but should not result in excessive bycatch and
(iii) traps should be able to catch the target pest.
As important as it is to select the correct pheromone lure (Pernek 2002, Schlyter et al. 1987a, Schlyter et al. 1987b, Schlyter et al. 1987c, Šramel et al. 2021), it is also very important to select the correct trap type (Flechtmann et al. 2000, Galko et al. 2016, Jakuš 1998, Kasumović et al. 2016, Lindgren 1983, Lindgren et al. 1983, Niemeyer 1985, Pernek 2002, Regnander and Solbreck 1981), as well as the appropriate trap placement (Andersson et al. 2011, Bakke 1985, Galko et al. 2016, Hayes et al. 2008, Jakuš 1998, Lindgren et al. 1983, Zahradník and Zahradníková 2015), when setting up a monitoring system. In the search for the most effective, reliable and discriminatory trap, many different trap types have been developed throughout history (Galko et al. 2016, Jakuš 1998, Lindgren 1983, Niemeyer 1985, Regnander and Solbreck 1981) and many improvements have been made (Bakke 1989, Galko et al. 2016, Lindgren 1983, Niemeyer 1985, Regnander and Solbreck 1981). For some trap types, as has been noted for cylinder traps (Regnander and Solbreck 1981), further possibilities for improvements are limited. For this reason, some countries have shifted from drainpipe traps to funnel traps (Marini et al. 2013). Traps must possess certain basic properties:
(i) the ability to catch as many individuals as possible without these individuals escaping,
(ii) the ability to catch organisms even at low concentrations and
(iii) reliable trapping effectiveness, i.e. the catch shows the flight activity of the monitored organism.
Nevertheless, we are in a period in which biodiversity is decreasing rapidly due mostly to direct human activity, and global warming is only accelerating the process (Gossner and Wohlgemuth 2020, Hillebrand and Matthiessen 2009, Pereira et al. 2010). Insect abundance is declining over all the world (Hallmann et al. 2017, Sánchez-Bayo and Wyckhuys 2019), not only in agricultural land but also in forests (Seibold et al. 2019). With this in mind, traps should also avoid catching too many other species, especially the predators and parasitoids of the target organism (Bakke 1989, Galko et al. 2016, Kasumović et al. 2016, Martín et al. 2013, Pernek 2002, Šramel et al. 2021, Wermelinger 2002, Weslien 1992). Although this can already be achieved by using species-specific pheromones (Spears et al. 2016) and “Allochthonous Kairomone” (Wehnert and Müller 2012), the chosen trap type is another method to avoid excessive bycatch. In Europe, there are several trap types used for catching spruce bark beetles and the most important is the slot trap (Niemeyer et al. 1983). For this reason, we tested three trap types that have a trapping surface of similar size (single slot, cross-vane and funnel traps) and one trap type with different sized trapping surfaces (single slot, double slot and triple slot traps). We tested the most important aspects, i.e. trapping effectiveness and selectivity, and compared them to the cost of the traps.
Our main aim was to evaluate different trap types for catching I. typographus. Several other studies have examined the effectiveness of traps for I. typographus (Galko et al. 2010, Galko et al. 2016, Kasumović et al. 2016, Niemeyer 1985, Pavlin 1991, Pernek 2002, Regnander and Solbreck 1981). Some have included the bycatch (Pavlin 1991, Pernek 2002); however, many have focused only on predators (Kasumović et al. 2016) or other bark beetle species (Galko et al. 2010) and some just on a specific group of species (Galko et al. 2016). We are therefore proposing an integrated framework comparable to that developed for the pheromones of I. typographus (Šramel et al. 2021) in which the user can easily see the pros and cons of different aspects of the traps and therefore make a more informed decision on which trap type to use in the monitoring system of I. typographus.
Our research question was to investigate the effectiveness, selectivity and costs of different traps. We compared five different commercially available trap types (single, double and triple slot traps; funnel trap; and cross-vane trap). We hypothesised that
(i) there would be a difference in I. typographus catch between single slot, funnel and cross-vane traps.
(ii) based on the previous research (Pernek 2002), we anticipate that the catch in our triple slot traps will also be twice as high as in single slot traps;
(iii) the bycatch would be higher in alternative traps i.e. cross-vane and funnel traps (larger opening) and traps with more surface area (such as double and triple slot taps) than in single slot traps;
(iv) the same pattern observed in the bycatch would be observed in the catch of I. typographus selected predators (Nemosoma elongatum, Thanasimus femoralis and Thanasimus formicarius); and
(v) additionally we investigated if it is possible to distinguish between undisturbed locations and those that were disturbed less than a year before the experiment (over autumn and winter) based on the catch rate of I. typographus.
We also presented total cost of the monitoring and the impact trap type choice has on the overal costs. We provided standardized index of effectiveness that shows the important properties of all five analysed trap types.
2 Materials and methods

Figure 1: Map showing the study region and trap locations. A) shows the four selected FMAs. B) shows the locations of the traps in the FMA Kranj, C) shows the locations of the traps in the FMA Ljubljana, D) shows the locations of the traps in the FMA Slovenj Gradec and E) shows the locations of the traps in the FMA Maribor. / Abbildung 1: Karte der Untersuchungsregion und Standort der Fallen. A) zeigt die vier ausgewählten FMAs. B) zeigt den Standort der Fallen in FMA Kranj, C) zeigt den Standort der Fallen in FMA Ljubljana, D) zeigt den Standort der Fallen in FMA Slovenj Gradec und E) zeigt den Standort der Fallen in FMA Maribor.
2.1 Location description
For our study, we selected four forest management (FMA) locations in Slovenia (Figure 1a). The presented coordinates are in WGS84 coordinate system. The Kranj FMA (46° 14' 19.4'' N, 14° 24' 12.98'' E) lies in the middle north-west part of Slovenia (Figure 1a) and has the characteristics of the Alpine and Sub-Alpine regions. It has 72,144 ha of forest, which covers 67 % of the surface. The soil mainly consists of a dolomite and limestone base. It has a mixture of a temperate Alpine and humid continental climates (ZGS 2012a).
The Ljubljana FMA (46° 11' 2.32'' N, 14° 27' 40.89'' E) lies in the middle of Slovenia (Figure 1a) and has characteristics of the Alpine, Dinaric-Pannonian regions. It has 145,254 ha of forest, which covers 58 % of the surface. The soil mainly consists of a dolomite and limestone base. It has a mixture of pre-Dinaric-pre-Pannonian climate and Alpine climates (ZGS 2012b).
The Maribor FMA (46° 29' 31.97'' N, 15° 32' 56.25'' E) lies in the middle north-east part of Slovenia (Figure 1a) and has characteristics of the Alpine and Pannonian regions. It has 96,790.57 ha of forest, which covers 42 % of the surface. The soil mainly consists of a carbonate and silicate base. It has a mixture of Sub-Alpine and Sub-Pannonian climates (ZGS 2012c).
The Slovenj Gradec FMA (46° 27' 39.99'' N, 15° 13' 15.08' E) lies in the middle north-east part of Slovenia (Figure 1a) and has characteristics of the Alpine and Dinaric-Pannonian regions. It has 59,577 ha of forest, which covers 68 % of the surface. The soil mainly consists of a silicate base. It has a mixture of Alpine and Pannonian climates (ZGS 2012d).
More details for comparison of all four locations are presented in Table 1.
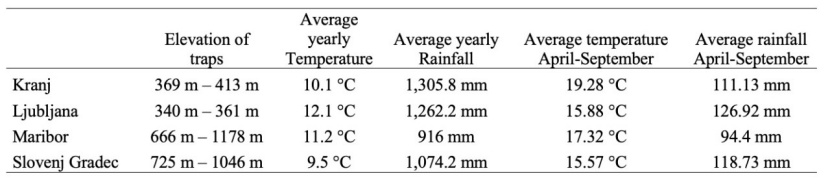
Table 1: Characteristics of the selected areas. Presented minimum and maximum elevation of the whole FMA location, min and max elevation of the taps, average yearly temperature and rainfall of 2020 and average temperature and rainfall from April until September of 2020. / Tabelle 1: Merkmale der ausgewählten Gebiete. Dargestellt sind die minimale und maximale Höhe des gesamten FMA-Orts, die minimale und maximale Höhe der Fallen, die durchschnittliche Jahrestemperatur und der durchschnittliche jährliche Niederschlag im Jahr 2020 sowie die durchschnittliche Temperatur und der durchschnittliche Niederschlag von April bis September 2020.
2.2 Experimental design and survey protocol
The experiment was conducted from mid-April to the end of September 2020. The traps were set in two locations in the western part of Slovenia (Kranj FMA and Ljubljana FMA) and two locations in the eastern part of Slovenia (Slovenj Gradec FMA and Maribor FMA) before the spring swarming (Figure 1 a). All four locations are in the Alpine region and have the same tree composition and share of Norway spruce (Picea abies). Although the altitude is different in the eastern and western part of Slovenia, the selected locations within the regions have a similar altitude. The elevation for the Ljubljana and Kranj FMA ranged from 340 m to 413 m and for the Slovenj Gradec and Maribor FMA from 666 m to 1178 m. The Ljubljana FMA and Slovenj Gradec FMA were selected as undisturbed locations. They were not affected by any natural disturbances in the autumn and winter of the year in which the experiment was carried out, and the population of bark beetles did not exceed the outbreak threshold. The Kranj FMA and Maribor FMA were used as disturbed locations. The selected disturbed locations were affected by a windthrow in February 2020, and the population of bark beetles also did not exceed the outbreak threshold. The outbreak threshold for Slovenian forests was estimated at 7,000 specimens of I. typographus, which are caught at least in one monitoring trap per season (Ogris et al. 2021).
For this experiment, we used five different commercially available traps: single, double and triple WitaTrap® bark beetle slot traps (slot trap; 50 x 49 x 6.5 cm), the Wita®Prall cross-vane panel trap (cross-vane trap; 129 x 40 x 40 cm) and WitaTrap® multi funnel trap (funnel trap; five funnels), all purchased from WITASEK® PflanzenSchutz GmbH. All traps were used as dry traps and randomly set at least one km away from each other on the southern exposure. We used the bark beetle aggregation pheromone IT Ecolure Extra® from Fytofarm as a blotter.
In the Kranj FMA (Figure 1b) and Ljubljana FMA (Figure 1c), we set up ten traps (altogether 20 traps) such that each type of trap had two repetitions per treatment (undisturbed/disturbed area). The traps from the Ljubljana FMA were set at an altitude of 340 m to 361 m (average 386.90 m), and the traps from the Kranj FMA were set at an altitude of 369 m to 413 m (average 350.20 m).
In the Maribor FMA (Figure 1d) and Slovenj Gradec FMA (Figure 1e), we set up 15 traps (altogether 30 traps) such that each type of trap had three repetitions per treatment (undisturbed/disturbed area). The traps in the Slovenj Gradec FMA were set at an altitude of 725 m to 1046 m (average 891.47 m), and the traps in the Maribor FMA were set at an altitude of 666 m to 1178 m (average 889.60 m).
Overall, we set up 50 traps; each type had five repetitions per treatment (undisturbed/disturbed area). The traps were emptied by regional units of the Slovenia Forest Service (SFS) every seven to 14 days. The collection date varied depending on the temperature, and if it rose above 24 °C, it was mandatory to empty the traps every seven days. All trap types had one bark beetle aggregation pheromone, which was regularly changed according to the manufacturer's instructions. The collected samples from the traps were preserved in 70 % alcohol, delivered to the Department of Forest Protection of the Slovenian Forestry Institute and stored in the refrigerator until morphological analysis.
2.3 Laboratory analyses
All samples were morphologically analysed in the laboratory of the Department of Forest Protection of the Slovenian Forestry Institute. The analyses were carried out with help of a stereomicroscope (Olympus SZX16) and Die Käfer Mitteleuropas identification keys (Freude et al. 1966; 1971; 1979; 1981; 1983; 1999, 2004, 2009, 2012). We counted the number of I. typographus, or we measured the volume and calculated the number by the formula 1 ml = 40 specimens of I. typographus. The bycatch was further separated into Coleoptera species and other taxa. Coleoptera species were determined to the family level, and 3 species of predators for I. typographus were determined to the species level if possible (Thanasimus femoralis, Thanasimus formicarius and Nemosoma elongatum). The bycatch of other taxa was determined to the lowest taxonomic level as possible.
2.4 Statistical analyses
All the data was analysed with the statistical program R (R Core Team 2018). We analysed the difference in the number of I. typographus, bycatch and separately for bycatch of 3 species of predators, and the composition of the beetle assemblage, between the different trap types. We performed a separate analysis because one trap group was intended to check the difference between alternative trap types, as the traps with similar trapping surface but different structure and openings; and the other trap group as the usage of the same trap type (single slot trap) in different arrangements (single, double, triple). For the comparison of I. typographus, bycatch and selected predators, we used a generalized linear model with a quasi-Poisson error distribution. The independent variables were the trap type, disturbed and undisturbed locations and the east and west locations, and the interaction between trap type and disturbance. Model selection was done on the basis of stepwise backwards selection. Because quasi-Poisson models do not produce an Akaike information criterion, the variables were selected when the significance level was lower than P = 0.05.
The bycatch composition was only analysed for beetle families. The dissimilarity of beetle families between trap types was analysed using a PERMANOVA with the Jaccard index (Anderson 2001). The dependent variable was a matrix with families in the columns and trap locations in the rows and absence and presence as values. The independent variables were trap type and disturbance type. The analysis was done with ADONIS in the “vegan” library (Oksanen et al. 2013) and used 999 permutations.
The most affected beetle family was determined by using the IndVal analysis. We checked only the difference between trap types and used 999 permutations when computing the model. The “indicspecies” library was used to determine the most affected families (De Cáceres and Legendre 2009).
2.5 Cost analyses
For the cost analysis, we considered all expenses related to the bark beetle monitoring performed by the regional units of the SFS. The cost of laboratory work used for this article was not included as it is usually not used for annual bark beetle monitoring in Slovenia. In the analysis, we used the cost of materials (traps, stands and pheromones) as well work and travel expenses. All prices for materials were obtained from invoices received from the companies supplying the traps. The cost of the workforce and travel expenses were provided by the SFS. Travel expenses were calculated with the standard SFS price per mile and work expenses with the average hourly rate for the second gross payment of district foresters.
2.6 Index of effectiveness analysis
Finally, we created an index of effectiveness based on Šramel et al. (2021), with which we calculated the effectiveness of the trap types. The index of effectiveness was calculated per trap as follows:
(i) The efficiency index (indexTC) was calculated as the average of the total catch of I. typographus per selected trap type (TC) divided by the maximum catch of I. typographus from all trap types (maxTC).
(ii) The selectivity index (indexBTCTC) was calculated as the average of the ratio between the number of bycatch (BTC) and the number of I. typographus from the selected trap type (TC), divided by the maximum ratio of bycatch/catch from all trap types (max(BTC/TC)).
(iii) Both components were summed and divided by two to obtain the total index of effectiveness. The index of effectiveness was then compared with the costs of the trap type.
3 Results
Altogether, we collected 797,242 specimens between mid-April and September 2020. The catch was composed of 727,249 I. typographus and 69,993 other specimens as bycatch. In the bycatch, there were 63,826 individuals of Coleoptera species and 6,167 individuals of other taxa. In the Coleoptera bycatch, we found 143 individuals of I. typographus selected predator species. Coleoptera was mostly represented by other Curculionidae species. The other more abundant Coleoptera families were Staphylinidae, Silphidae, Leiodidae, Scarabaeidae and Elateridae. All other Coleoptera taxa had less than 400 specimens (Table 2). Among 143 selected predators of I. typographus, there were 71 specimens of Nemosoma elongatum, 46 of Thanasimus femoralis and 26 of Thanasimus formicarius. The largest portion of other taxa bycatch was represented by specimens from Hymenoptera and Hemiptera, followed by Diptera, Dermaptera and Araneae. All other taxa had less than 80 specimens. A surprising result was catching four rodent specimens (Table 2).

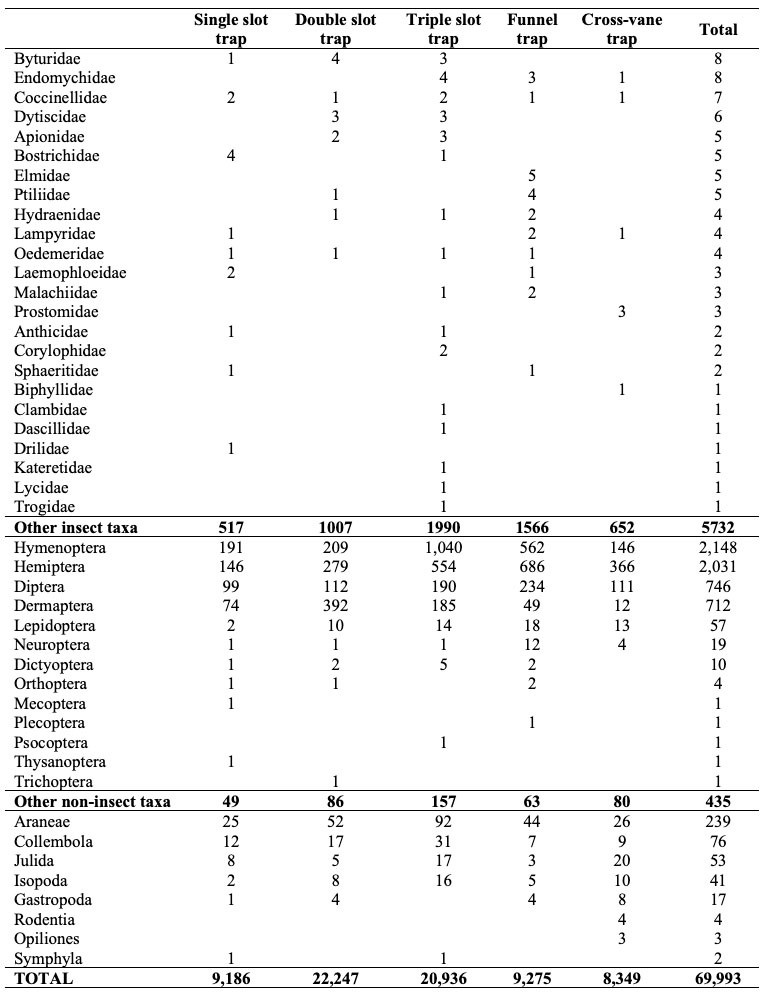
Table 2: The composition of bycatch according to the lowest taxonomic level as possible and families within the Coleoptera order. The total number of trapped individuals of all traps is presented. / Tabelle 2: Die Zusammensetzung des Beifangs nach der niedrigsten taxonomischen Ebene und nach Familien innerhalb der Ordnung der Coleoptera.
3.1 Comparison between trap types
For the I. typographus catch, none of the variables were included in the model. There were no significant differences in number of specimens caught (N) between the single slot trap (N = 133,304; median = 11,876, mean = 838.39), cross-vane trap (N = 116,384; median = 11,745.5, mean = 741.3) and funnel trap (N = 118,014; median = 9,879.5, mean = 742.23) (Figure 2a); between the undisturbed location and disturbed location (Figure 3a); or between western and eastern Slovenia (Table 3).
For the number of specimens of bycatch, none of variables were included in the model. There were no significant differences between the single slot trap (N = 9,186; median = 777.5, mean = 57.06), cross-vane trap (N = 8,349; median = 690, mean = 51.86) and funnel trap (N = 9,275; median = 595, mean = 57.61) (Table 2 and Figure 2c); between the undisturbed location and disturbed location (Figure 3); or between western and eastern Slovenia (Table 3 and Figure 3c). We noted that all four rodents were caught in cross-vane traps (Table 2).
The model with selected predators did not include any variables. There were no significant differences between the single slot trap (N = 11), cross-vane trap (N = 38) and funnel traps (N = 58) (Figure 2e), or between the disturbance regime (Figure 3e) and location of the experiments (Table 3). Nevertheless, there was slight tendency (P = 0.079) for funnel traps to catch more predators than single slot traps (Table 2).
There was no difference in family composition (F = 1.0797, R2 = 0.07405, P = 0.3457). The families Staphylinidae (stat = 0.743, P = 0.021) and Melandryidae (stat = 0.632, P = 0.025) were more frequently found in funnel traps (Table 2).
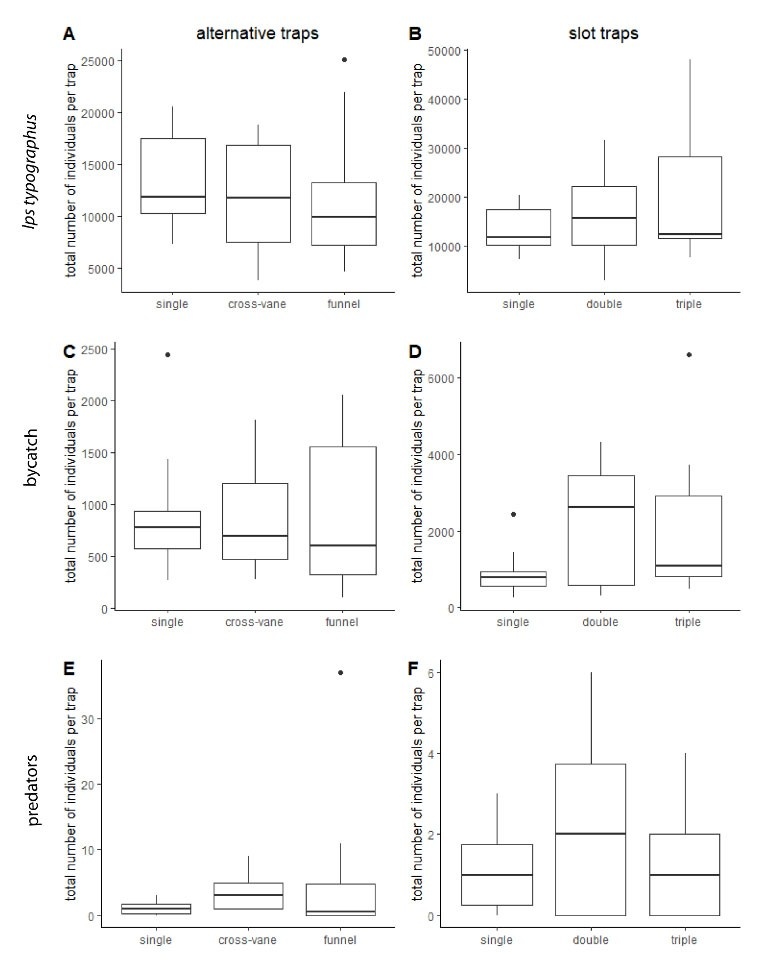
Figure 2: Comparison between different types of alternative traps (single slot, cross-vane and funnel) for A) the total number of I. typographus caught, C) bycatch, and E) predators of I. typographus and different types of slot traps (single, double and triple) for B) the number of I. typographus caught, D) bycatch and F) predators of I. typographus. The data are shown in boxplots with the represented by the median value, 25th and 75th percentiles and outliers (black dots). / Abbildung 2: Vergleich zwischen verschiedenen alternativer Fallentypen (Einfach-Schlitz-, Kreuzbarrieren- und Trichterfallen) für A) die Gesamtzahl der gefangenen I. typographus, C) den Beifang und E) die Prädatoren von I. typographus und verschiedenen Arten von Schlitzfallen (Einfach-, Doppel- und Dreifachfallen) für B) die Anzahl der gefangenen I. typographus, D) den Beifang und F) die Prädatoren von I. typographus. Die Daten sind in Boxplots mit dem Medianwert, dem 25. und 75. Perzentil und den Ausreißern (schwarze Punkte) dargestellt.

Figure 3: Comparison between control and disturbed areas where there were alternative traps (single slot, cross-vane and funnel) for A) the total number of I. typographus caught, C) bycatch, and E) predators, and different types of slot traps (single, double and triple) for B) the number of I. typographus caught, D) bycatch and F) predators. The data are shown in boxplots with the represented by the median value, 25th and 75th percentile, and outliers (black dots). / Abbildung 3: Vergleich zwischen Kontrollgebieten und Gebieten mit Störung, in denen alternative Fallen (Einfach-Schlitz-, Kreuzbarrieren- und Trichterfallen) eingesetzt wurden, für A) die Gesamtzahl der gefangenen I. typographus, C) den Beifang und E) die Prädatoren sowie verschiedene Arten von Schlitzfallen (Einfach-, Doppel- und Dreifachfallen) für B) die Anzahl der gefangenen I. typographus, D) den Beifang und F) die Prädatoren. Die Daten sind in Boxplots mit dem Medianwert, dem 25. und 75. Perzentile und den Ausreißern (schwarze Punkte) dargestellt.
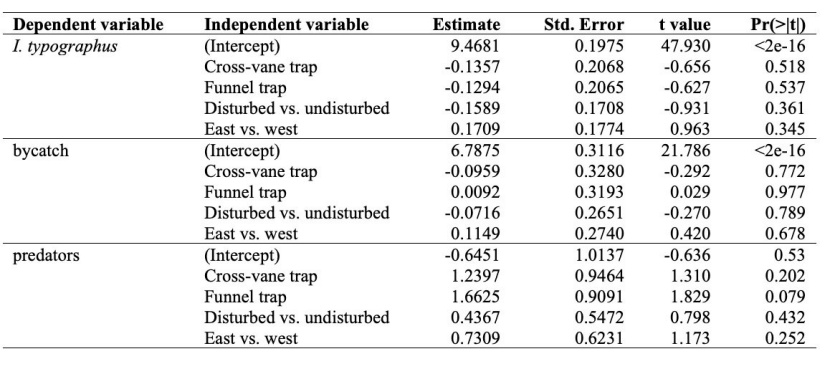
Table 3: Model statistics of single slot, cross-vane and funnel traps for effectiveness, bycatch and I. typographus predator model. The other traps are compared to the single slot trap, undisturbed locations are compared to disturbed locations and the eastern FMAs are compared to the western FMAs. / Tabelle 3: Modellstatistiken von Einfach-Schlitz-, Kreuzbarrieren- und Trichterfallen für Wirksamkeit, Beifang und das I. typographus-Prädator-Modell. Die anderen Fallen werden mit der Einfach-Schlitzfalle verglichen, Orte ohne Störung werden mit Orten mit Störung verglichen und die östlichen FMAs werden mit den westlichen FMAs verglichen.
3.2 Comparison between slot traps
For the analysis of the number of caught I. typographus, the only two independent variables that had significant impact on its abundance were the type of trap and the region of Slovenia. The number of I. typographus caught increased from single (N = 133,304; median = 11,876, mean = 838.39) to double (N = 158,992; median = 15,856, mean = 999.95) to triple (N = 200,555; median = 12,487.5, mean = 1,261.35) slot traps (Figure 2b and Table 4). We found a statistically significant difference between the first and the third slot trap (Figure 2 and Table 4). Furthermore, there was an increase of I. typographus in eastern Slovenia (Slovenj Gradec and Maribor) compared to western Slovenia (Kranj and Ljubljana) (Table 4). There was also not a significant difference between the disturbance regime (Figure 3b) (P = 0.072, Table 4).
Similar to I. typographus, the trap type and the region of Slovenia were included in the best model for the bycatch. Both the double (N = 22,247; median = 2,617.5, mean = 138.18) and triple (N = 20,936; median = 1,081.5, mean = 130.04) slot traps had a higher number of bycatch compared to the single slot traps (N = 9,186; median = 777.5, mean = 57.06) (Figure 2, Table 2 and Table 4). In eastern Slovenia, there was a higher bycatch compared to western Slovenia (Table 4). There was also not a significant difference between the disturbance regime (Figure 3d).
For the number of I. typographus selected predators, none of the variables were included in the model. The abundance of selected predators was very low in all three slot traps: single (N = 11), double (N = 22) and triple (N = 14). There was also no difference observed between eastern and western Slovenia (Table 4). There was also not a significant difference between the disturbance regime (Figure 3f).
There was no difference observed in the bycatch composition between the different slot traps (F = 1.65, R2 = 0.11, P = 0.17). The IndVal analysis showed that only the triple slot trap had characteristic families: Ciidae (stat = 0.803, P = 0.001), Elateridae (stat = 0.751, P = 0.037), Staphylinidae (stat = 0.728, P = 0.010), Nitidulidae (stat = 0.726, P = 0.018), Salpingidae (stat = 0.725, P = 0.043), Histeridae (stat = 0.721, P = 0.04) and Zopheridae (stat = 0.624; P = 0.034) (Table 2).
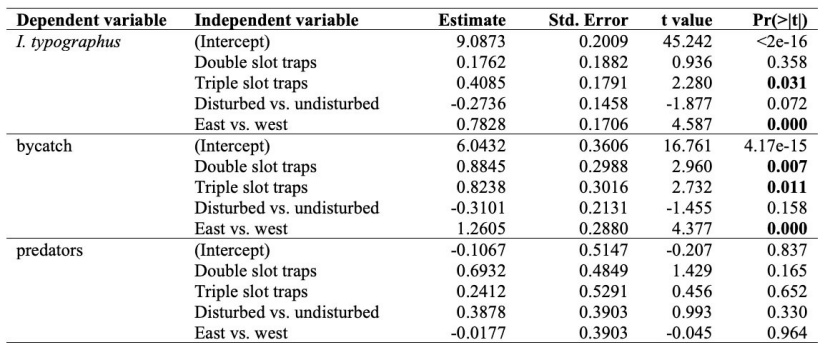
Table 4: Model statistics of the single, double and triple slot traps for effectiveness, bycatch and the I. typographus predator model. The other traps are compared to the single slot trap, undisturbed locations are compared to disturbed locations and the eastern FMAs are compared to the western FMAs. Differences with significant values are shown in bold. / Tabelle 4: Modellstatistiken von Einfach-, Zweifach- und Dreifach-Schlitzfallen für Wirksamkeit, Beifang und das I. typographus-Prädator-Modell. Die anderen Fallen werden mit der Einfach-Schlitzfalle verglichen, Orte ohne Störung werden mit Orten mit Störung verglichen und die östlichen FMAs werden mit den westlichen FMAs verglichen. Unterschiede mit signifikanten Werten sind fett gedruckt.
3.3 Cost analysis
Based on the cost analysis presented in Table 5, the cost of the workforce (51.25 %) is the largest expense in monitoring. The cost of traps (24.71 %) represents the second largest share of the overal expenses, followed by pheromones (15.06 %) and travel expenses (8.98 %).
If we compare the costs of all expenses (workforce, traps, pheromones and travel expenses) per trap type, the triple slot trap type accounted for the largest amount of the expenses (24.98 %), followed by the double (21.71 %) and single (18.45 %) trap types. The cost of the cross-vane trap type (17.83 %) was less than all three slot trap types, and the funnel trap type (17.03 %) used the minimum amount of the overal costs.

Table 5: The total cost of traps (including the cost of supporting structures), pheromones, travel and workforce expenses for the whole season. * Initial costs of the traps with stands, but they can be reused for multiple seasons. / Tabelle 5: Gesamtkosten für Fallen (einschließlich der Kosten für Standfüße), Pheromone, Reisekosten und Arbeitskräfte für die gesamte Saison. * Anfängliche Kosten für Fallen mit Standfüßen, sie können jedoch in mehreren Saisons verwendet werden.
3.4 Index of effectiveness
Among the different trap types, the single slot trap was the best trap type according to the selected properties, even for both sub-indices. Nevertheless, among the alternative traps, the single slot trap is the most expensive. Among the different slot traps, the triple slot trap had the highest index of effectiveness but was closely followed by the single slot trap. Even though, the triple slot trap was the best based on index of effectiveness, the single slot trap had less bycatch. Regarding the costs of the slot traps, the single slot trap is one-third the cost of the triple slot trap (Table 6).

Table 6: Standardized index for the different trap types. / Tabelle 5: Standardisierter Index für die verschiedenen Fallenarten.
4 Discussion
Based on the results of our analysis, there is no significant difference in effectiveness between the alternative traps, i.e. the single slot, funnel and cross-vane traps. Even though there was slightly more catch in the single slot trap, our first hypothesis is rejected. Due to some difficulties in the field, the rise in efficiency from single to triple slot trap was only 33.5 % and not 50 % in our study, therefore our second hypothesis is rejected. We predicted that the alternative traps, i.e. cross-vane and funnel traps, will catch more bycatch compared to the single slot trap. However, this turned out not to be the case, since we failed to find significant difference among them. Although the difference was not statistically significant, we found more bycatch in the funnel traps. Based on these results, we reject the first part of our third hypothesis. The double slot trap had the highest total bycatch abundance compared to the triple slot trap. Since the difference was not statistically significant between the single, double and triple slot traps, we also reject the second part of our third hypothesis. Our fourth hypothesis, that the catch of I. typographus selected predators would exhibit the same pattern as the whole bycatch, can be confirmed since we did not find a significant difference between the three alternative trap types and between the three slot traps for the bycatch as well as for the catch of selected predators. Since different trap types have a different number of components, different materials, etc., and therefore differ in prices as well. If we compare the difference in price for all five trap types together, the decision on which trap type to use will have a large impact on the whole monitoring budget. Our fifth hypothesis is rejected since there was no statistically significant difference between disturbed and undisturbed locations based on the catch rate of I. typographus, which means that in the locations affected by the windthrow in February, the population of I. typographus did not grow significantly in the same year. Thus, we can conclude that trap expenses can represent a significant part of the monitoring budget, depending on the purpose of the monitoring and type of traps selected. Based on the calculated index of effectiveness, the single slot trap scored the highest among the alternative traps (single slot, cross-vane and funnel). Interestingly, the triple slot trap is better than the single slot trap since the triple slot trap scored higher in the number of caught I. typographus nevertheless, the single slot trap scored better in selectivity compared to the triple slot trap. However, the cost of the single slot trap is only one-third of the cost of the triple slot trap.
4.1 Comparison between trap types
The catch effectiveness of certain types of traps depends on the dimensions of the traps, which are determined by the biology of the target group of insects (Chandler 2010, Epsky et al. 2008, Southwood 1975). Several studies have shown that different species of Scolytinae are attracted to different trap types (Flechtmann et al. 2000, Lindgren et al. 1983, McCravy et al. 2000). For some species, even the colour of traps is an important factor (Campbell and Borden 2006, González-Audino et al. 2011). However, for I. typographus, the colour does not play an important role unless the trap is white. In that case, the trap catches fewer specimens (Dubbel et al. 1985, Niemeyer 1985).
In analysing the effectiveness of traps in catching I. typographus, we did not find a statistically significant difference between the single slot, funnel and cross-vane traps, which is consistent with the results of Galko et al. (2016), although that study analysed additional types of traps (Ecotrap, BEKA trap, slot trap, Lindgren funnel trap, funnel trap and cross trap – which is similar to our cross-vane trap). Although the study of Flechtmann et al. (2000) was done on other species of Scolytinae, the results are quite interesting. When analysing the number of all beetles caught, regardless of the species, there were also no differences between the traps tested. However, when they included the trap surface area in the model, it showed that the ESALQ-84 trap caught significantly more beetles than the other traps. The trap itself resembles the structure of our cross-vane model, but it is smaller and narrower and appears more like a square than a rectangle (15.6 x 14 x 14 cm). In our research, there were slightly more I. typographus caught in the single slot trap compared to the funnel trap, and the cross-vane trap had the least amount of catch. Similar results were found by Pernek (2002), where the single slot trap was better than the Ecotrap and the Bakke improvised tubular trap. Similar results were obtained for Ips avulsus and Ips grandicollis, which were caught statistically more frequently or in larger quantities in slot traps compared to funnel traps, while for Ips calligraphus, no significant difference in catch rate was recorded between these two traps (McCravy et al. 2000). However, this contradicts the results of Galko et al. (2010), where the Lindgren funnel traps (12 funnels) caught 18 % more I. typographus than the slot traps (Theysohn). Furthermore, even though the differences in Galko et al. (2016) were not statistically significant, the single slot trap never had the highest catch of I. typographus during the three-year period. The reason might be the use of slightly different trap models. Compared to the traps used in Galko et al. (2016), the single slot traps used in our study are almost the same (ours: 50 x 49 x 6.5 cm; theirs: 57 x 49 x 6 cm), the cross trap is slightly lower and wider than our cross-vane trap model (ours: 129 x 40 x 40 cm; theirs: 115 x 50 x 50 cm), and both funnel traps are significantly longer than the model we used (ours: five funnels; theirs: twelve funnels, both models). Furthermore, if we look at the results of the last period from Galko et al. (2016), the highest catch was found in the cross trap. However, they used different trap positioning each year and also made modifications to some traps, which in turn might have been the reason for the high inconsistency in catch rate between traps throughout the three-year period. We believe that further investigations are needed since a comparison of the results with other research suggests that the use of different models of the same trap type may affect their effectiveness.
Šramel et al. (2021) proved that pheromone trap catches allow distinguishing between affected or disturbed locations and those undisturbed by I. typographus through the difference in their catch abundance. The chosen disturbed locations in that study were affected by a windthrow one year before the experiment. In the present study, we tested whether we might be able to detect the difference even in the locations affected by windthrow less than a year before the experiment since, in Slovenia, I. typographus has two generations (Jurc and Kolšek 2012, Jurc et al. 2006, Šramel et al. 2021). The disturbance happened in February 2020, two months before the traps were set. Our results are in line with other research (de Groot et al. 2018, Göthlin et al. 2000, Inouye 1962, Wermelinger et al. 1999) in which the abundance of bark beetles increased one year after a natural disturbance.
The bycatch or catch of non-target organisms is an undesirable effect of any kind of trapping method which includes traps with pheromones (Bakke 1989, Galko et al. 2016, Pavlin 1991, Pernek 2002, Valkama et al. 1997). While predators and some other species are attracted to the pheromone (Bakke and Kvamme 1981), other bycatch can be attracted to substances emitted by the attacked host tree or the decomposing smell of beetles, or some specimens end up in the wrong place at the wrong time (Pavlin 1991, Valkama et al. 1997).
Larger openings are only one of the reasons, based on which we predicted that alternative traps would catch more bycatch than single slot traps. There is also the ability of some species to successfully escape from the traps (Martín et al. 2013). Even though the lowest abundance of bycatch was caught in the single slot trap, followed by the cross-vane and funnel traps, the differences were not statistically significant. Since the bycatch usually corresponds to the catch of I. typographus (Pavlin 1991, Šramel et al. 2021), and we did not find a statistical difference in I. typographus catch between traps, this result for the bycatch is expected. The proportion of bycatch ranged from 6.5 % (single slot trap) to 7.3 % (funnel trap), which is slightly higher than 6.4 %found in Šramel et al. (2021) for single slot traps bated only with It Ecolure Extra pheromone. Pavlin (1991) had 5 % bycatch in single slot traps bated with Pheroprax® pheromone. In some articles in which different trap types were compared, the data on bycatch were not published due to the low number of specimens (Galko et al. 2016) or other technical issues (Pernek 2002); therefore, a comparison is quite difficult to make. The first two most abundant Coleoptera families were Curculionidae and Staphylinidae, the same as found in Šramel et al. (2021); however, the next two were Silphidae and Leodidae, whose abundance was higher. While the reason for the higher catch of Leodidae is unknown, one of the main reasons for high numbers of Silphidae in the catch is usually because of the poor draining ability of the traps (Galko et al. 2016, Kasumović et al. 2016), and species from this family are attracted to the smell of dead organisms (Kretschmer 1990). Unfortunately, poor draining ability not only means more species of Silphidae in the catch, but it also lowers the number of I. typographus in the catch (Kretschmer 1990). The highest number of Silphidae were found in funnel traps, followed by cross-vane and single slot traps. Indicative Coleoptera families were found only in the funnel traps: Staphylinidae and Melandryidae. When considering the whole bycatch, it is worth mentioning that Dubbel et al. (1985) and Niemeyer (1985) noticed that white traps attract more bycatch. Interestingly, in the study of Šramel et al. (2021), there were no representatives from the taxa Gastropoda, which were found in smaller numbers in the present study in almost all trap types. However, their presence in traps has already been documented (Pavlin 1991). There was one bycatch that stood out. Four rodents managed to get caught in the cross-vane traps. Based on the photographs received, the species appeared to be Muscardinus avellanarius. Even though that is a very low number, it is still very unpleasant for the workers who are emptying the traps. In one case the animal was still alive and was set free. However, the beetles were mostly eaten, and what remained was very hard to determine.
There are many predators and parasites that feed on I. typographus larvae as well as on the adults (Hilszczajski et al. 2007, Valkama et al. 1997, Wermelinger 2002, Weslien 1992). The predators are attracted to the pheromone emitted by I. typographus (Bakke and Kvamme 1981). The most concerning are the catch of vulnerable organisms and predators of the target organism. Weslien (1992) estimated that predators and parasites of I. typographus reduce its productivity by 83 %. Such a high estimation was found by Wermelinger (2002) only in the second year of the study, while in the first year it was only 54 %. Nevertheless, the percentage of mortality is still high and important for the reduction of the I. typographus population.
In the present study, our attention was focused on only three species of I. typographus predators, i.e. Nemosoma elongatum, Thanasimus femoralis and Thanasimus formicarius. The lowest number of caught selected predators was in the single slot traps (1 per 13,000 arthropod individuals). This number increased in the cross-vane (1 per 3,000 arthropod individuals) and funnel traps (1 per 2,000 arthropod individuals). It was interesting that the catch of Nemosoma elongatum doubled in the funnel trap compared to the cross-vane trap. In the study of Pavlin (1991), the difference in the catch rate of Nemosoma elongatum was more dependent on the use of different pheromones than on the type of trap. It turned out that the pheromone for Pityogenes chalcographus (Chalcoprax®) attracts more specimens of Nemosoma elongatum. Since in our study we used the same pheromone (IT Ecolure Extra®) in all traps, the reason for the higher catch rate in funnel traps might be due to the different structure of the trap, which makes it harder for Nemosoma elongatum to escape. Martín et al. (2013) noted that funnel traps catch significantly higher numbers of Thanasimus formicarius compared to the slot traps and that the difference is due to the species’ greater ability to escape from the slot traps. Although we did not compare all five trap types together, there is one important result we obtained during our study when analysing the number of caught selected predators and that is that all three slot traps had a lower number of caught selected predators than the funnel and cross-vane traps.
4.2 Comparison between slot traps
When comparing the three slot traps, we found a statistically significant difference between the single and triple slot traps, but there was no significant difference between the single and double slot trap. In terms of differences, the double slot trap had on average 1.2 times higher catch than in single slot trap, or in other words the difference was 16.2 %. The triple slot trap had on average 1.5 times higher catch than the single slot trap or in other words, the difference was 33.5 %. Pernek (2002) also compared single and triple slot traps and the difference between the single and triple slot trap was 1.9 times higher, meaning that the difference was 46.4 % in favour of the triple slot trap. This difference is larger than that found in our study. The results for some locations from the eastern part of Slovenia for triple slot traps had a very low catch compared to the other triple slot traps. This is especially visible from the statistic where the total number is higher for the triple slot trap compared to the double slot trap, but when comparing the median number, the median of the double slot trap is higher than the median of the triple slot trap. Schroeder (2013) emphasized that the catch rate of I. typographus is much more dependent on external factors compared to that of P. chalcographus, which is visible from the higher catch variability between the traps. The proposed reason was the narrower niche of I. typographus, which is limited to breeding material larger than 15 cm in diameter due to its larger body size (Schroeder 2013). Similar variability in annual catch rate between different traps was also seen in Galko et al. (2016), even for the traps that did not have any improvements and only the placement of the traps was changed. There are some confusing results in Dimitri et al. (1992), where they compared the difference between massive use of single and triple slot traps compared with the sporadic use of only single slot traps, where the latter treatment had almost the same or just slightly lower, and in some years even higher catch rate, than the treatment with massive trapping.
Here we do have to emphasize that we used only one pheromone per trap type. Based on the results of Zahradník and Zahradníková (2015), the difference in effectiveness might be higher if there were two pheromone dispensers in the double slot trap and three pheromones in the triple slot trap. There is also an interesting comparison between wet and dry slot traps in Kasumović et al. (2016). Unfortunately, they did not find any statistically significant difference for I. typographus. However, they emphasize that dry traps are easier to handle in the field as well as in the laboratory when determining specimens. Here it is also worth mentioning that dry slot traps cost less than the wet slot traps, as also pointed out by Kasumović et al. (2016).
The bycatch of slot traps almost corresponded to the catch of I. typographus as well. As expected, the single slot trap had the lowest abundance of the bycatch. To our surprise, the double slot trap had a larger bycatch than the triple slot trap. This is likely due to the problem in the selection of locations for the triple slot traps in the eastern part of Slovenia, as described above. Interestingly, the analysis showed indicative Coleoptera family only for the triple slot trap: Ciidae, Elateridae, Staphylinidae, Nitidulidae, Salpingidae, Histeridae and Zopheridae.
4.3 Costs and index of effectiveness analysis
Costs and the available budget is an important aspect to consider when setting up monitoring (Bakke 1989; 1991, Dimitri et al. 1992, González-Audino et al. 2011, Jakuš 1998, Lindgren 1983). Although prices are different than in the study on the effectiveness of pheromones (Šramel et al. 2021), the proportions of costs remained almost the same. The biggest contributor to overal costs were the cost of the workforce. In the study of Šramel et al. (2021), the cost of pheromones was higher compared to the cost of traps and stands in comparison to those costs in our study, where the expenses changed places as the use of mixed trap types consequently increased the share of the used budget. In our study with mixed use of traps, the cost of traps represented 24.71 % of the whole budget. However, this high share is mostly due to the double and triple slot traps, which are rarely used in the field.
If we would use only the most affordable trap type (funnel trap), the whole budget would decrease by 14.87 % compared to the mixed model. Compared to the funnel trap, the use of only cross-vane trap would result in a 4.53 % increase in the budget and the use of only single slot trap would increase the whole budget by 7.72 % compared to the use of only funnel traps. However, the cost is not the only aspect of making the decision which trap to choose for monitoring. Based on the calculated indices, the single slot trap had the highest scores for the number of caught I. typographus and selectivity (number of caught bycatch species), which consequently led to the highest final index of effectiveness. In other words, the single slot trap was the best trap type among the alternative traps based on the selected properties.
If we would use only the triple slot trap the budget would increase by 19.92 % compared to the mixed model. The triple slot trap scored the highest in the final index of effectiveness among all three variations of the slot traps. While the single slot trap had the highest score in selectivity, the score of the triple slot trap for the number of caught I. typographus was much greater, which made the triple slot trap the best trap among all three trap types. However, even though the number of caught I. typographus almost doubled in the triple slot trap its price is three times greater than the price of the single slot trap. Since the selectivity is one of the important aspects of traps, the results have shown us that all three variations of slot traps had lower number of caught selected predators compared to the cross-vane and funnel traps.
Nevertheless, the expenses of traps and stands are usually included only in the first year of monitoring since they can be reused in subsequent monitoring. Therefore, the question is what kind of monitoring to set up. If this is one year research and we are not planning to use traps next season, we might choose funnel traps since the difference among the alternative traps in effectiveness and selectivity was not statistically significant and it scored second best by the index of effectiveness. However, we have to keep in mind that this data is for dry traps only. If we are preparing for monitoring that will take place over several years, the most affordable trap might not be the best choice. We were not able to check durability of the traps, however the materials of cross-vane trap did not look very promising and if they are assembled, they took a lot of space in the vehicle and are clumsy for carrying them to the hard-to-reach location. While the material of funnel traps locks better, the only thing that could get problematic throughout the years are connections between funnels. Depending on the model, some funnel traps can be folded nicely even when assembled, therefore taking less space in vehicle. However, depending on the length, they might be a bit clumsy when carrying them to the hard-to-reach location. The slot traps are hard and robust, they might take more space in vehicle compared to the funnel traps and since they are from one non-movable peace when assembled, they are easier to carry to the hard-to-reach locations. This is of course for single slot traps. The more you need to carry the harder it gets. If the goal of the monitoring is to catch as much I. typographus as possible, then the bets trap type is the triple slot trap. If you are looking for robust and selective trap, the best one is single slot trap. If you have easy to reach locations where the trap will not get entangled in the branches, the funnel trap is also an option. If you only need few traps and easy to reach locations, you can also use cross-vane trap. However, some small mammals could get caught in them.
5 Conclusions
Our goal was to test three different commercially available traps and three different slot traps for I. typographus. We examined all aspects (effectiveness, selectivity and cost) of the single slot, funnel and cross-vane traps as well as compared the single, double and triple slot traps. Based on recent studies and our data, it is noticeable that in terms of effectiveness of catching I. typographus among the most frequently used trap types in Europe, i.e. single slot, cross-vane and funnel traps, there are no statistically significant differences between them regarding trapping effectiveness (Galko et al. 2016) or influence on bycatch. In terms of the trapping effectiveness of the three slot traps, the difference becomes significant only between the single and triple slot traps. However, while the number of caught I. typographus almost doubles, the expenses for traps and stands triples. The bycatch of double and triple slot traps was relatively low but still higher than that in the alternative traps. From an economic perspective, the price of the single slot trap and cross-vane trap is very similar, while that of the funnel trap is lower. Based on all gathered information, it is noticeable that all traps have pros and cons. Additionally, we created an index of effectiveness that could help researchers and foresters to decide which trap type is most appropriate for monitoring. Although, based on the selected properties of all five trap types, the triple slot trap had the highest score in the combined index, the difference in price compared to effectiveness is too great. Further research is needed to explore other potential variants of the existing traps and to work on new prototypes to increase effectiveness and reduce bycatch and potential costs. Therefore, we recommend, at least for Slovenia, that we continue to work with the single slot trap since it has the fewest negative properties (even though not significant) for our needs, i.e. catch of selected predators, bycatch and, judging from Silphidae abundance, a better drainage system.
Acknowledgements
We would like to express our gratitude to the foresters from ZGS who helped with the fieldwork and Eva Groznik for helping with sorting samples in the laboratory. The authors would also like to thank the Slovenian Research Agency and the Ministry of Agriculture, Forestry and Food, who supported the project ‘Improvement of the monitoring system for catching spruce bark beetles in undisturbed pheromone traps and the system of setting of undisturbed traps and the development of an application for location planning and abundance of undisturbed traps and trap logs by regulatory units of the Slovenia Forest Service (V4-1822).
Conflicts of Interest
The authors declare no conflicts of interest. None of the authors are employed by one of the trap manufacturer or did receive funding from a trap manufacturer.
References
Andersson M.N., Binyameen M., Sadek M.M. & Schlyter F. (2011). Attraction Modulated by Spacing of Pheromone Components and Anti-attractants in a Bark Beetle and a Moth. Journal of Chemical Ecology, 37, 899-911.
Baier P., Pennerstorfer J. & Schopf A. (2007). PHENIPS – A comprehensive phenology model of Ips typographus (L.) (Col., Scolytinae) as a tool for hazard rating of bark beetle infestation. Forest Ecology and Management, 249(3), 171-186.
Bakke A. (1985). Deploying pheromone-baited traps for monitoring Ips typographus populations. Zeitschrift Für Angewandte Entomologie, 99, 33-39.
Bakke A. (1989). The Recent Ips typographus Outbreak in Norway: Experiences from a Control Program. Holarctic Ecology, 12(4), 515-519.
Bakke A. (1991). Using pheromones in the management of bark beetle outbreaks. In Baranchikov Y.N., Mattson W.J., Hain F.P. & Payne T.L. (eds.): Forest Insect Guilds: Patterns of Interaction with Host Trees. U.S. Department of Agriculture, Forest Service, Northeastern Forest Experiment Station, Radnor, pp. 371-377.
Bakke A. & Kvamme T. (1981). Kairomone response in Thanasimus predators to pheromone components of Ips typographus. Journal of Chemical Ecology, 7, 305-312.
Campbell S.A. & Borden J.H. (2006). Close-range, in-flight integration of olfactory and visual information by a host-seeking bark beetle. Entomologia Experimentalis et Applicata, 120, 91-98.
Chandler P. (eds.). (2010). A Dipterist's Handbook (2nd Edition). Orpington, Amateur Entomologists' Society, 525 pp.
De Cáceres M. & Legendre P. (2009). Associations between species and groups of sites: Indices and statistical inference. Ecology, 90, 3566-3574.
de Groot M., Ogris N. & Kobler A. (2018). The effects of a large-scale ice storm event on the drivers of bark beetleoutbreaks and associated management practices. Forest Ecology and Management, 408, 195-201.
Dimitri L., Gebauer U., Lösekrug L. & Vaupe O. (1992). Influence of mass trapping on the population dynamic and damage-effect of bark beetles. Journal of Applied Entomology, 114(1-5), 103-109.
Dubbel V., Kerck K., Sohrt M. & Mangol S. (1985). Influence of trap color on the efficiency of bark beetle pheromone traps. Zeitschrift Für Angewandte Entomologie, 99, 59-64.
Epsky N.D., Morrill W.L. & Mankin R.W. (2008). Traps for Capturing Insects. In Capinera J.L. (eds.): Encyclopedia of Entomology. Springer, Dordrecht, pp. 3887-3901.
Fernandez-Carrillo A., Patočka Z., Dobrovolný L., Franco-Nieto A. & Revilla-Romero B. (2020). Monitoring Bark Beetle Forest Damage in Central Europe. A Remote Sensing Approach Validated with Field Data. Remote Sensing, 12(21), 1-19.
Fettig C.J. & Hilszczański J. (2015). Chapter 14 - Management Strategies for Bark Beetles in Conifer Forests. In Vega F.E. & Hofstetter R.W. (eds.): Bark Beetles. Academic Press, San Diego, pp. 555-584.
Flechtmann C.A.H., Ottati A.L.T. & Berisford C.W. (2000). Comparison of Four Trap Types for Ambrosia Beetles (Coleoptera, Scolytidae) in Brazilian Eucalyptus Stands. Journal of Economic Entomology, 93(6), 1701-1707.
Forest Europe. (2020). State of Europe’s Forests 2020. Ministerial Conference on the Protection of Forests in Europe – FOREST EUROPE, Bratislava, 392 pp.
Freude H., Harde K.W. & Lohse G.A. (1966) Die Käfer Mitteleuropas Band 9, Cerambycidae - Chrysomelidae. Krefeld, Goecke & Evers, 299 pp.
Freude H., Harde K.W. & Lohse G.A. (1971) Die Käfer Mitteleuropas. Band 3, Adephaga II, Palpicornia. Krefeld, Goecke & Evers, 335 pp.
Freude H., Harde, K.W. & Lohse G.A. (1979) Die Käfer Mitteleuropas. Band. 6, Diversicornia (Lycidea-Byrrhidae). Krefeld, Goecke & Evers, 367 pp.
Freude H., Harde K.W. & Lohse G.A. (1981) Die Käfer Mitteleuropas Band. 10, Bruchidae, Anthribidae, Scolytidae, Platypodidae, Curculionidae. Krefeld, Goecke & Evers, 310 pp.
Freude H., Harde K.W. & Lohse G.A. (1983) Die Käfer Mitteleuropas Band 11: Curculionidae II. Krefeld, Goecke & Evers, 344 pp.
Freude H., Harde, K.W. & Lohse G.A. (1999) Die Käfer Mitteleuropas. Band 8, Teredilia - Heteromera - Lamellicornia. Krefeld, Goecke & Evers, 288 pp.
Freude H., Harde K.W. & Lohse G.A. (2004) Die Käfer Mitteleuropas. Band 2, Adephaga 1, Carabidae (Laufkäfer). Heidelberg, Spektrum Akademischer Verlag, 521 pp.
Freude H., Harde, K.W. & Lohse G.A. (2009) Die Käfer Mitteleuropas. Band. 7, Clavicornia (Ostomidae-Cisdae). Krefeld, Goecke & Evers, 310 pp.
Freude H., Harde, K.W. & Lohse G.A. (2010) Die Käfer Mitteleuropas. Band. 5, Staphylinidae II (Hypocyphtinae und Aleocharinae) Pselaphidae. Krefeld, Goecke & Evers, 381 pp.
Freude H., Harde, K.W. & Lohse G.A. (2012) Die Käfer Mitteleuropas. Band 4, Staphylinidae (exklusive Aleocharinae, Pselaphinae und Seydmaeninae). Heidelberg, Spektrum Akademischer Verlag, 560 pp.
Galko J., Gubka A., Vakula J. & Brutovský D. (2010). Comparison of catches of the spruce bark beetle (Ips typographus L.) (Coleoptera: Scolytidae) in pheromone traps of Canadian and European production. Forestry Journal, 56(4), 337-347.
Galko J., Nikolov C., Kunca A., Vakula J., Gubka A., Zúbrik M., Rell S. & Konôpka B. (2016). Effectiveness of pheromone traps for the European spruce bark beetle: a comparative study of four commercial products and two new models. Lesnícky časopis – Forestry Journal, 62, 207-215.
González-Audino P., Gatti P. & Zerba E. (2011). Traslucent pheromone traps increase trapping efficiency of ambrosia beetle Megaplatypus mutatus. Crop Protection, 30, 745-747.
Gossner M.M. & Wohlgemuth T. (2020). Do we need squirrels everywhere? On the distinction between biodiversity and nature. In Krumm F., Schuck A. & Rigling A. (eds.): How to balance forestry and biodiversity conservation. A view across Europe. European Forest Institute (EFI); Swiss Federal Institute for Forest, Snow and Landscape Research (WSL), Birmensdorf, pp. 133-145.
Göthlin E., Schroeder L.M. & Lindelöw A. (2000). Attacks by Ips typographus and Pityogenes chalcographus on Windthrown Spruces (Picea abies) During the Two Years Following a Storm Felling. Scandinavian Journal of Forest Research, 15(5), 542-549.
Grégoire J.C., Raffa K.F. & Lindgren B.S. (2015). Chapter 15 - Economics and Politics of Bark Beetles. In Vega F.E. & Hofstetter R.W. (eds.): Bark Beetles. Academic Press, San Diego, pp. 585-613.
Hallmann C.A., Sorg M., Jongejans E., Siepel H., Hofland N., Schwan H., Stenmans W., Müller A., Sumser H., Hörren T., et al. (2017). More than 75 percent decline over 27 years in total flying insect biomass in protected areas. PLOS ONE, 12(10), 1-21.
Hayes C.J., Degomez T.E., Clancy K.M., Williams K.K., Mcmillin J.D. & Anhold J.A. (2008). Evaluation of Funnel Traps for Characterizing the Bark Beetle (Coleoptera: Scolytidae) Communities in Ponderosa Pine Forests of North-Central Arizona Jurnal of Economic Entomology, 101(4), 1253-1265.
Hillebrand H. & Matthiessen B. (2009). Biodiversity in a complex world: consolidation and progress in functional biodiversity research. Ecology Letters, 12, 1405-1419.
Hilszczajski J., Gibb H. & Bystrowski C. (2007). Insect natural enemies of Ips typographus (L.) (Coleoptera, Scolytinae) in managed and unmanaged stands of mixed lowland forest in Poland. Journal of Pest Science, 80, 99-107.
Hlásny T., Krokene P., Liebhold A., Montagné-Huck C., Müller J., Qin H., Raffa K., Schelhaas M.J., Seidl R., Svoboda M., et al. (2019). Living with bark beetles: impacts, outlook and management options. From Science to Policy 8. European Forest Institute, 52 pp.
Inouye M. (1962). Details of Bark Beetle Control in the Storm‐swept Areas in the Natural Forest of Hokkaido, Japan. Journal of Applied Entomology, 51(1-4), 160-164.
Jakuš R. (1998). A method for the protection of spruce stands against Ips typographus by the use of barriers of pheromone traps in north-eastern Slovakia 71(8), 152-158.
Jurc D. & Kolšek M. (2012). Navodila za preprečevanje in zatiranje škodljivcev in bolezni gozdnega drevja v Sloveniji. Silva Slovenica, Gozdarski institut Slovenije, Ljubljana, 104 pp.
Jurc M., Perko M., Džeroski S., Demšar D. & Hrašovec B. (2006). Spruce bark beetles (Ips typographus, Pityogenes chalcographus, Col.: Scolytidae) in the Dinaric mountain forests of Slovenia: Monitoring and modeling. Ecological Modelling, 194, 219-226.
Kasumović L., Hrasovec B. & Jazbec A. (2016). Efficency of dry and wet flight barrier Theysohn pheromone traps in catching the spruce bark beetles Ips typographus L. and Pityogenes chalcographus L. Šumarski list, 9-10, 477-484.
Kretschmer V.K. (1990). Zur Wirkung von Aasgeruch auf die Fangleistung yon Buchdruckerfallen. Anzeiger Für Schädlingskde Pflanzensdautz Umweltschutz, 63(3), 46-48.
Lindgren B.S. (1983). A multiple funnel trap for Scolytid beetles (Coleoptera). The Canadian Entomologist, 115, 299-302.
Lindgren B.S., Borden J.H., Chong L., Friskie L.M. & Orr D.B. (1983). Factors influencing the efficiency of pheromone-baited traps for three species of ambrosia beetles (Coleoptera: Scolytidae). The Canadian Entomologist, 115, 303-313.
Marini L., Lindelöw Å., Jönsson A.M., Wulff S. & Schroeder L.M. (2013). Appendix A1 – Changes in trapping methods during the monitoring period. OIKOS, 0, 1-2.
Martín A., Etxebeste I., Pérez G., Álvarez G., Sánchez E. & Pajares J. (2013). Modified pheromone traps help reduce bycatch of bark-beetle natural enemies. Agricultural and Forest Entomology, 15, 86-97.
McCravy K.W., Nowak J.T., Douce G.K. & Berisford C.W. (2000). Evaluation of Multiple-Funnel and Slot Traps for Collection of Southern Pine Bark Beetles and Predators. Journal of Entomological Science, 35(1), 77-82.
Nagel T.A., Mikac S., Dolinar M., Klopcic M., Keren S., Svoboda M., Diaci J., Boncina B. & Paulic V. (2017). The natural disturbance regime in forests of the Dinaric Mountains: A synthesis of evidence. Forest Ecology and Management, 388, 29-42.
Niemeyer H. (1985). Field response of Ips typographus L. (Col., Scolytidae) to different trap structures and white versus black flight barriers. Zeitschrift für Angewandte Entomologie, 99, 44-51.
Niemeyer H., Schroeder T. & Watzek G. (1983). Eine neue Lockstoff-Falle zur Bekämpfung von rinden- und holzbrütenden Borkenkäfern. Der Forst- und Holzwirt, 38(5), 105-112.
Ogris N., Kolšek M. & de Groot M. (2021). Predlog števila in lokacij kontrolnih-lovnih pasti in kontrolno-lovnih nastav v 2021. Napovedi o zdravju gozdov, 1-12.
Oksanen J., Blanchet F.G., Friendly M., Kindt R., Legendre P., McGlinn D., Minchin P.R., O'Hara R.B., Simpson G.L., Solymos P., et al. (2013). Vegan: Community Ecology Package, R package version 2.0-7 edn. Journal of Statistical Software, 48, 1-21.
Pavlin R. (1991). Problem selektivnosti sintetičnih feromonov za obvladovanje podlubnikov. Zbornik gozdarstva in lesarstva, 38, 125-160.
Pereira H.M., Leadley P.W., Proença V., Alkemade R., Scharlemann J.P.W., Fernandez-Manjarrés J.F., Araújo M.B., Balvanera P., Biggs R., Cheung W.W.L., et al. (2010). Scenarios for Global Biodiversity in the 21st Century. Science, 330(6010), 1496-1501.
Pernek M. (2002). Analysis of biological efficiency of feromon preparations and types of traps used for capturing bark beetle Ips typographus L. and Pityogenes chalcographus L. (Coleoptera; Scolytidae). Radovi – Šumarski Institut Jastrebarsko, 37(1), 61-83.
R Core Team. (2018). R: A Language and Environment for Statistical Computing. Vienna, Austria: R Foundation for Statistical Computing. https://www.r-project.org
Regnander J. & Solbreck C.H. (1981). Effectiveness of different types of pheromone traps used against Ips typographus (L.) (Col., Scolytidae) in Sweden. Anzeiger Für Schädlingskde Pflanzensdautz Umweltschutz, 54, 104-108.
Ryall K.L. & Fahrig L. (2005). Habitat loss decreases predator-prey ratios in a pine-bark beetlesystem. OIKOS, 110, 265-270.
Sánchez-Bayo F. & Wyckhuys K.A.G. (2019). Worldwide decline of the entomofauna: A review of its drivers. Biological Conservation, 232, 8-27.
Schlyter F., Birgersson G., Byers J.A., Lofqvist J. & Bergstrom A.G. (1987a). Field response of spruce bark beetle, Ips typographus, to aggregation pheromone candidates. Journal of Chemical Ecology, 13(4), 701-716.
Schlyter F., Byers J.A. & Lofqvist J. (1987b). Attraction to pheromone sources of different quantity, quality, and spacing: Density-Regulation Mechanisms in Bark Beetle Ips typographusl. Journal of Chemical Ecology, 13(6),
Schlyter F., Lofqvist J. & Byers J.A. (1987c). Behavioural sequence in the attraction of the bark beetle Ips typographus to pheromone sources. Physiological Enfornology, 12, 185-196.
Schroeder L.M. (2013). Monitoring of Ips typographus and Pityogenes chalcographus: influence of trapping site and surrounding landscape on catches. Agricultural and Forest Entomology, 15, 113-119.
Seibold S., Gossner M.M., Simons N.K., Blüthgen N., Müller J., Ambarlı D., Ammer C., Bauhus J., Fischer M., Habel J.C., et al. (2019). Arthropod decline in grasslands and forests is associated with landscape-level drivers. Nature, 574, 671-674.
Southwood T.R.E. (1975). Ecological methods : With particular reference to the study of insect populations. Chapman & Hall, London, 391 pp.
Spears L., Looney C., Ikerd H., Koch J., Griswold T., Strange J. & Ramirez R. (2016). Pheromone Lure and Trap Color Affects Bycatch in Agricultural Landscapes of Utah. Environmental Entomology, 45(4), 1-8.
Šramel N., Kavčič A., Kolšek M. & de Groot M. (2021). Estimating the most effective and economical pheromone for monitoring the European spruce bark beetle. Journal of Applied Entomology, 145(4), 312-325.
Valkama H., Raty M. & Niemela P. (1997). Catches of Ips duplicatus and other non-target Coleoptera by Ips typographus pheromone trapping. Entomologica Fennica, 8(3), 153-159.
Wehnert M. & Müller M. (2012). ‘Allochthonous Kairomones’ in stands of European beech (Fagus sylvatica) – Approach for nature-based bark beetle management with clerid beetles (Thanasimus spp.). Biological Control, 62, 16-23.
Wermelinger B. (2002). Development and distribution of predators and parasitoids during two consecutive years of an Ips typographus (Col., Scolytidae) infestation. Journal of Applied Entomology, 126, 521-527.
Wermelinger B. (2004). Ecology and management of the spruce bark beetle Ips typographus – a review of recent research. Forest Ecology and Management, 202, 67-82.
Wermelinger B., Obrist M.K. & Duelli P. (1999). Development of the bark beetle (Scolytidae) fauna in windthrow areas in Switzerland. Mitteilungen der Schweizerischen Entomologischen Gesellschaft, 72(3-4), 209-220.
Weslien J. (1992). The arthropod complex associated with Ips typographus (L.) (Coleoptera, Scolytidae) species composition, phenology, and impact on bark beetle productivity. Entomologica Fennica, 3, 205-213.
Weslien J., Annila E., Bakke A., Bejer B., Eidmann H.H., Narvestad K., Nikula A. & Ravn H.P. (1989). Estimating risks for spruce bark beetle (Ips typographus (L.)) damage using pheromone‐baited traps and trees. Scandinavian Journal of Forest Research, 4(1-4), 87-98.
Zahradník P. & Zahradníková M. (2015). The efficacy of a new pheromone trap setup design, aimed for trapping Ips typographus (Coleoptera, Curculionidae, Scolytinae). Šumarski list, 3-4, 181-186.
ZGS. (2012a). Gozdnogospodarski načrt gozdnogospodarskega območja Kranj (2011 – 2020) Št. 03/11. Ljubljana, Zavod za gozdove Slovenijeo območna enota Kranj, 478 pp.
ZGS. (2012b). Gozdnogospodarski načrt gozdnogospodarskega območja Ljubljana (2011 – 2020) Št. 04/11. Ljubljana, Zavod za gozdove Slovenijeo bmočna enota Ljubljana, 1192 pp.
ZGS. (2012c). Gozdnogospodarski načrt gozdnogospodarskega območja Maribor (2011 – 2020) Št. 12/11. Ljubljana, Zavod za gozdove Slovenijeo območna enota Maibor, 396 pp.
ZGS. (2012d). Gozdnogospodarski načrt gozdnogospodarskega območja Slovenj Gradec (2011 – 2020) Št. 11/11. Ljubljana, Zavod za gozdove Slovenijeo območna enota Slovenj Gradec, 319 pp.


