Schlüsselbegriffe: H-D-Modelle, logistisches Modell, Vorrat, Laserscanning, Kalabrische Kiefer, Schwarzkiefer, Pinus brutia, Pinus nigra
See below the issue 4/2022 as E-Paper or have a look at our E-Paper archive dating back to 1955.
This work is licensed under a Creative Commons Attribution-ShareAlike 4.0 International License.
Abstract
Tree height is one of the most important variables in estimating growing stock volume, carbon stock, site quality, tree growth and yield. Because measurement of tree height is labor-intensive and time consuming, height-diameter models are generally used for height estimates. In this study, twenty existing nonlinear height-diameter models were fitted and evaluated for Calabrian pine (Pinus brutia Ten.) and Crimean pine (Pinus nigra J.F. Arnold subsp. pallasiana (Lamb.) Holmboe) in the Cemaller region, northwestern Türkiye. The best results were obtained with the 3-parameter logistic type model for both species, accounting for about the 79% and 84% of the total variance in height-diameter relationships of Calabrian pine and Crimean pine, respectively. The fitted simple height-diameter models with diameter at breast height as an independent variable can now be used to estimate total tree heights for both species. As a side result, there was significant difference in height-diameter relationship between the two species. The height-diameter models developed in this study can provide accurate height estimates for growth and yield assessment, when tree height measurements are not available and the height-diameter relations of the target region as in this study region.
Zusammenfassung
Baumhöhe ist eine der wichtigen Variablen zur Abschätzung von Vorrat, Kohlenstoff, Bonität, Baumwachstum und Ertrag. Da das Messen der Baumhöhe aufwändig und kostenintensiv ist, werden häufig Baumhöhe-Durchmesser-Modelle verwendet, um Baumhöhen zu schätzen. In dieser Studie wurden zwanzig nichtlineare Höhen-Durchmesser-Modelle für Kalabrische Kiefer (Pinus brutia Ten.) und Schwarzkiefer (Pinus nigra J.F. Arnold subsp. pallasiana (Lamb.) Holmboe) in der Cemaller Region im Nordwesten der Türkei getestet. Für beide Baumarten haben wir die besten Ergebnisse vom 3-Parameter-Logistik-Modell erhalten, das 79 % und 84 % der beobachteten Varianz erklärte. Dieses einfache Höhen-Durchmesser-Modell verwendet Brusthöhendurchmesser als unabhängige Variable und kann für Schätzungen der Baumhöhe der zwei untersuchten Baumarten verwendet werden. Wir konnten einen signifikanten Unterschied zwischen der Höhen-Durchmesser-Beziehung der zwei Baumarten beobachten. Die Höhen-Durchmesser-Modelle aus dieser Studie erlauben die Schätzung von Baumhöhen, falls Messungen der Baumhöhe nicht verfügbar sind und die Höhen-Durchmesser-Beziehungen in der Anwendungsregion ähnlich sind wie jene in dieser Studie.
1 Introduction
Tree height (h) and diameter at breast height (d) are two fundamental variables in forestry. These variables are widely used for determining tree volume, developing growth and yield models, estimating site index, describing vertical and horizontal structures of a forest stand, and so decision making in forest management (Clutter et al., 1983; Calama and Montero, 2004; Temesgen and Gadow, 2004; van Laar and Akça, 2007; Baral et al., 2020; Subedi et al., 2021). Although these variables are the basis of forest inventory, measurement of h of standing tree is more difficult, time consuming and expensive than d measurement (Baral et al., 2022), especially in mountainous regions (van Laar and Akça, 2007; Seki and Sakici, 2022a). Besides, measurement of h would introduce more error than d measurement, especially in dense stands (Williams et al., 1994). For these reasons, unmeasured tree heights are usually estimated using an appropriate h-d model (Huang et al., 1992; Koulelis et al., 2018).
Simple h-d models, including only d as an independent variable, is often suitable for a region with uniform stand characteristics. Although there is a strong correlation between h and d, this relationship may vary by tree species and stand characteristics in larger areas with heterogeneous stand structures. For example, it was reported that h-d allometry of Jarrah species (Bhandari et al., 2021) and growth of Oriental beech (Yücesan et al., 2015) were affected by thinning. For this reason, some other covariates have been used in addition to d in h-d models (often referred to as generalized h-d models) to increase the success of height estimation, in many studies where it is not possible to explain h-d relationship with a single curve (Weiskittel et al., 2011). Stand variables used in the generalized h-d models are diverse such as quadratic mean diameter, stand density, mean height, dominant height, dominant diameter, etc. (Vargas-Larreta et al., 2009; Sonmez, 2009; Misir, 2010, Ercanlı, 2015; Çatal and Carus, 2018, Lebedev, 2020). The time, cost and labor required to use these two model forms are of course different from each other. Unlike a simple h-d model, generalized h-d models require more field measurement effort, time and cost. That is the reason of why simple h-d models are seen more suitable for practical applications (Han et al., 2021), and have been chosen to estimate tree heights in environments with homogeneous stand characteristics (Carus and Çatal, 2017; Carus and Akguş, 2018).
Because forest inventory is expensive in many countries, numerous studies have examined alternative methods usually enhanced by remote sensing resources such as terrestrial and aerial LİDAR (Mäkelä and Pekkarinen, 2004; Meyer et al., 2013; Vatandaşlar and Zeybek, 2020). Although promising results were obtained by most of the studies, poor accuracies for height estimation were also detected in some cases. For example, while handheld laser scanning technology met the accuracy standards for most stand measurements, stand height was estimated poorly in some studies (Cabo et al., 2018; Vatandaşlar and Zeybek, 2020). Besides, most of these studies conducted at local scale with specific forest types, species and topography. Therefore, accuracy of these new techniques should be proved for different forest types, species and topographic conditions. By revealing the full potential of such tools for the wide range of forest types and topographies, forest managers will be able to profit from them in operational level. Especially, many studies conducted in Türkiye underlined the need of further analyses for diverse forest types with high amount of sample sizes (Vatandaşlar and Zeybek, 2021; Zeybek and Vatandaşlar, 2021; Narin et al., 2022). Besides, there is also still need for conventional ground measurement in forest inventories for investigating qualitative variables including stem quality, and quantitative variables such as tree/stand age which can’t be determined easily in natural forests. Moreover, access to such technologies is difficult and expensive, especially for developing countries like Türkiye. Therefore, it can be said that ground measurements in forest inventory and allometric equations to estimate tree attributes are still essential, at least today.
Calabrian pine (Pinus brutia Ten.) and Crimean pine (Pinus nigra subsp. pallasiana (Lamb.) Holmboe) are the most widely distributed coniferous tree species in Türkiye, with total areas of about 5.3 million ha (22.9% of total forest area) and 4.2 million ha (18.2% of total forest area) (GDF, 2021). They are also important and valuable coniferous species in Turkish forestry due to their high wood quality. Despite the high ecological and economic importance of these tree species, a limited number of studies have investigated the h-d relationships of them (Çatal, 2012; Özçelik and Çapar, 2014; Özçelik et al., 2014; Carus and Çatal, 2017; Çatal and Carus, 2018; Ercanlı, 2020, Seki and Sakici, 2022a). Moreover, these studies were conducted in many different geographical regions of Türkiye. Therefore, a usable h-d model is not available for many regions where these species are distributed.
Cemaller is one of the important regions of northwestern Türkiye where Calabrian pine and Crimean pine naturally grow together. Pure and mixed stands of these two pine species occupy approximately 75% of the total region and are mostly managed for wood production. However, there is no existing h-d models for both species. Since the above-mentioned models were developed for geographically different and remote locations, it is highly likely that they will result high biases in predicting tree height in the Cemaller region. This shortcoming leads extra inventory costs for plan makers, practitioners and scientists. Besides, foresters have been using a single-entry volume equation (GDF, 2015) which includes only d as a predictor variable to estimate individual tree volumes in the region. Because, measuring h in this region with steep topography is laborious, and there is no available h-d model. For this reason, a suitable h-d model can provide the use of double-entry tree volume equations in the region. There is a need of robust h-d models to estimate heights of these species for forest managers, plan makers and scientists in the region. Therefore, the primary objective of this study was to develop h-d models using d as a predictor variable for estimating h of Calabrian pine and Crimean pine in the Cemaller region. Besides, this study also investigated whether h-d relationship differs depending on species in the sampled sites.
2 Materials and methods
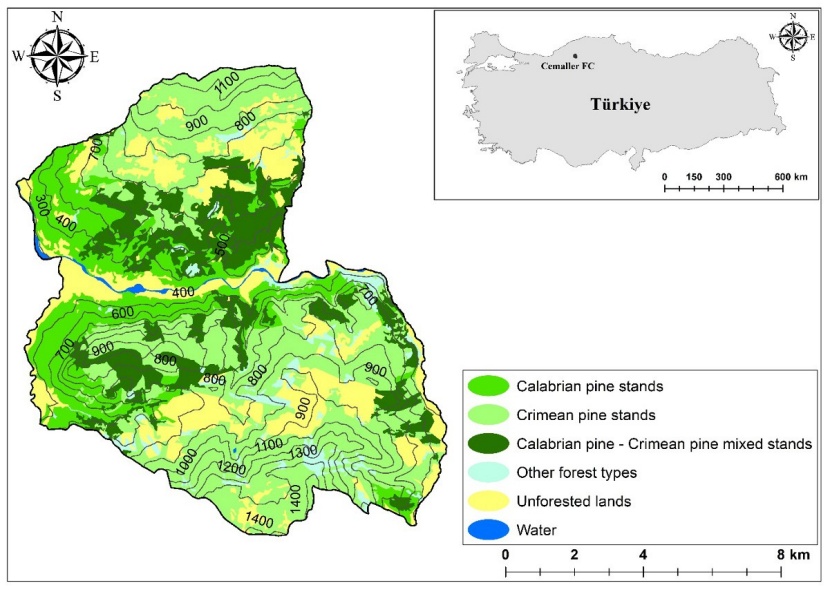
Figure 1: Study area. / Abbildung 1: Untersuchungsregion.
2.1 Study area and data description
The study was conducted in pure and mixed stands of Calabrian pine and Crimean pine in Cemaller Forest Chiefdom (FC) within the boundaries of Karabük Forest Enterprise in Zonguldak Regional Directorate of Forestry, northwestern Türkiye (Figure 1). The climate of the region is semi-arid, mesothermal, excess water in winter and moderate ocean (sea) type. Annual precipitation in the region varies between 400-800 mm, with mean annual temperature of about 13.4 °C. Soil types derived from clayey gypsum and sandy limestone are common in the study area (GDF, 2015).
The total area of the studied FC is about 10800 ha, and the selected pine species cover approximately 75% of the total area. All of the Cemaller FC forests are in the state ownership. Although there are ecological (soil conservation) purposes in very small locations, a large part of the studied FC forests is managed for economic (wood production) purposes. According to forest management plan for Cemaller FC, the site quality of the forest stands located in the whole FC is low-moderate according to site index classifications for Calabrian pine (Alemdağ, 1962) and Crimean pine (Kalıpsız, 1963). Calabrian pine and Crimean pine stands are managed with rotation ages of about 50 and 100 years, respectively. Namely, 10- and 20-years age-class methods are applied to Calabrian pine and Crimean pine.
Elevation of the Cemaller FC approximately varies from 300 to 1400 m. While Crimean pine alone forms pure stands at high altitudes (approximately 800-1400 m), both species grow in pure and mixed stands at altitudes lower than about 800 m. In this study, the elevation intervals where Calabrian pine and Crimean pine grow together were selected to investigate. Besides, care was taken to ensure that the sampled stands were naturally regenerated stands (not planted). All the sampled stands were even-aged with no evidence of major disturbances such as forest fire, storm damage, disease and insect.
The data used in this study consisted of measurements of trees standing on forty temporary sample plots (TSPs) from pure and mixed stands of Calabrian pine and Crimean pine. Circular sample plots were set as 400, 600 and 800 m2 for crown closures of ≥71%, 41%–70% and 11%–40%, respectively. In each sample plot, d of all living trees greater than 7.9 cm and h of 14-16 trees representing different d and h classes were measured using a caliper (with an accuracy of 0.1 cm) and electronic clinometer (Haglöf EC-II) (with an accuracy of 0.1 m), respectively. The sampled forest stands are naturally regenerated and even-aged stands representing an available range of stand characteristics such as the quadratic mean diameter (11.7 – 34.4 cm), basal area (9.20 – 37.68 m2 ha-1) and relative density (2.91 – 6.91). A total of 608 h-d measurements (257 and 351 individuals for Calabrian pine and Crimean pine, respectively) were obtained. The statistics for the sample trees, including minimum, maximum, mean, and standard deviation (SD) values of d and h, are summarized in Table 1.
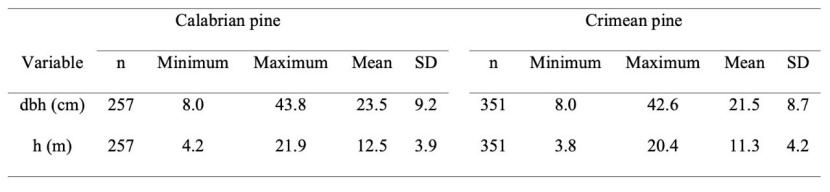
Table 1: Summary statistics of the sample trees. Dbh is diameter at breast height, h is tree height, n number of observations, SD is standard deviation. / Tabelle 1: Zusammenfassung der Probebäume. Dbh ist Brusthöhendurchmesser, h ist Baumhöhe, n Anzahl Bäume, SD ist Standardabweichung.
The available tree h-d data were randomly divided into two group: model development (85%) and model validation (15%) for each species. The scatterplots showing the relationship between d and h for each group and species are shown in Figure 2.
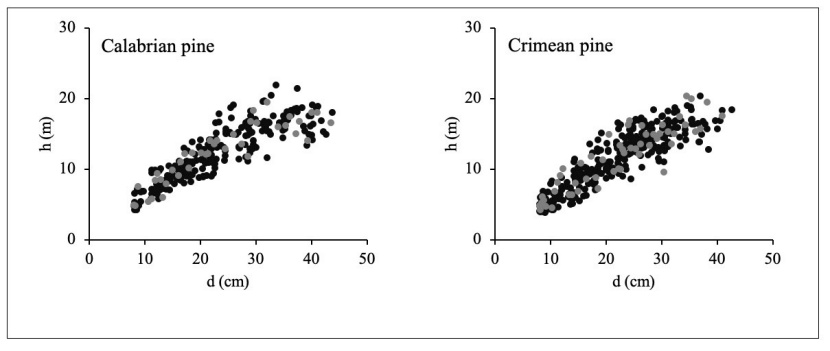
Figure 2: Plots of tree height (h) against diameter at breast height (d). Black and gray dots indicate model fitting and validation data, respectively. / Abbildung 2: Darstellung von Baumhöhe (h) versus Brusthöhendurchmesser (d). Schwarze Punkte zeigen Schätzdaten, graue Punkte die Validierungsdaten.
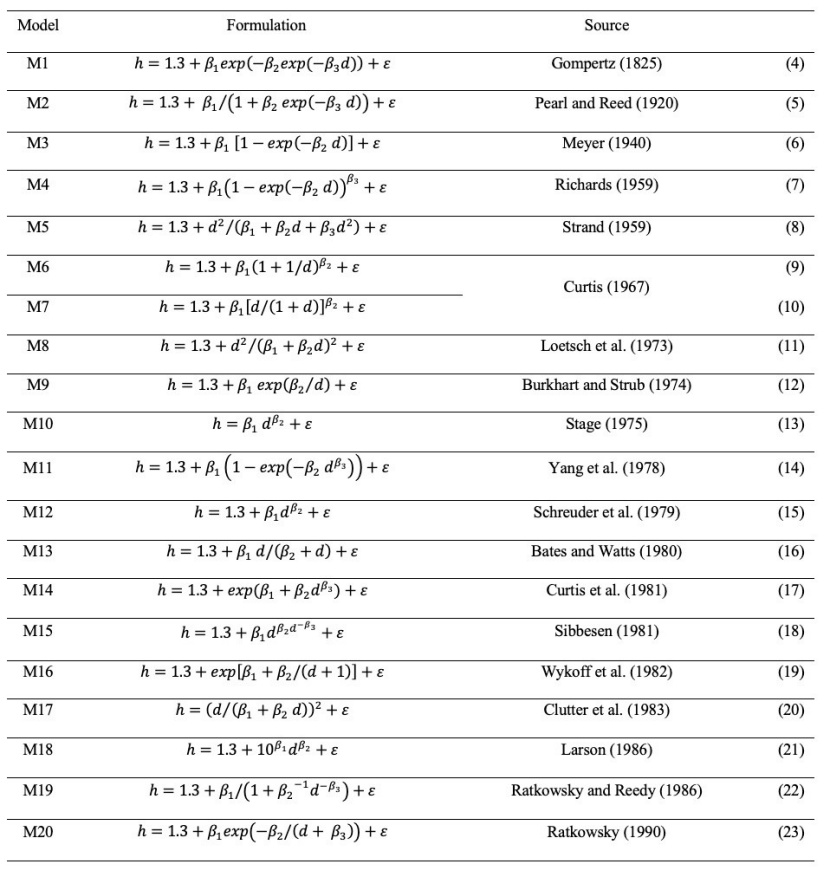
Table 2: Candidate h-d models. ε is the error term. / Tabelle 2: Getestete h-d-Modelle. ε ist der Fehlerterm.
2.2 Height-diameter models
As underlined in previous studies, nonlinear models are much more accurate than linear models in representing h–d relationship of individual trees (Sharma, 2016; Han et al., 2021; Bolat et al., 2022). After the recommendations of previous studies and the preliminary examination of the data used in this study, 20 different nonlinear candidate h–d models that are frequently used were selected (Table 2). All the models were fitted by nonlinear regression analysis using the MODEL procedure within SAS/ ETSTM statistical package (SAS Institute Inc., 2004).
2.3 Model evaluation and validation
In this study, four goodness–of–fit statistics were used: adjusted coefficient of determination (Radj2), bias (E̅), absolute mean deviation (AMD), and root mean square error (RMSE). The statistics were calculated as follows:
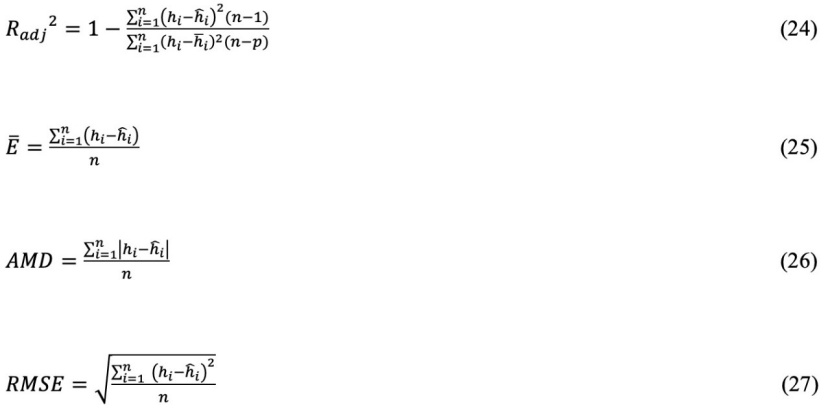
where hi, ĥi, ħi, are observed, estimated and mean height values, respectively, n is the number of data used for fitting.
The relative ranking system proposed by Poudel and Cao (2013) was used to determine the relative position of each fitting model. The relative ranks were calculated using following formula (Poudel and Cao, 2013; Sun et al., 2019).

where Ri is the relative rank of model i (i=1, 2,…, m), m is the number of models fitted, Si is the corresponding goodness-of-fit statistic of model i, Smin and Smax are the best and worst values of Si, respectively. Afterward, all ranks for each model were summed and re-ranked to determine overall ranks. The lowest (1) and highest (20) ranks refer to the best and worst models, respectively. In addition, paired t–test was utilized for the estimated and observed tree heights for model validation data set.
2.4 Comparison of height-diameter relationship between species
The selected best model was fitted to each species separately and then to both species combined. The nonlinear extra sum of squares method was used to examine whether h-d allometry differs between Calabrian pine and Crimean pine. This method has generally been used to investigate differences among the geographically different regions (Pillsbury et al., 1995; Huang et al., 2000). Besides, it has also been used to examine differences among the species (Corral Rivas et al., 2004; Özçelik and Dirican, 2017) and clones (Rodríguez et al., 2010). The test statistic is given as follows:

where F* follows an F-distribution, SSER and SSEF are the error sum squares associated with the reduced model (with the same set of parameters for two species) and full model (with a different set of parameters for each species based on dummy variables), respectively. dfR and dfF are the degrees of freedom of the reduced and full model, respectively.
3 Results
The parameter estimates and their corresponding approximated standard errors for the twenty models are given in Table 3. All of the model parameters were found to be significant at p<0.05, excluding parameter β2 of M5 and β3 of M20 for both species, and parameter β1 of M18 for Calabrian pine.
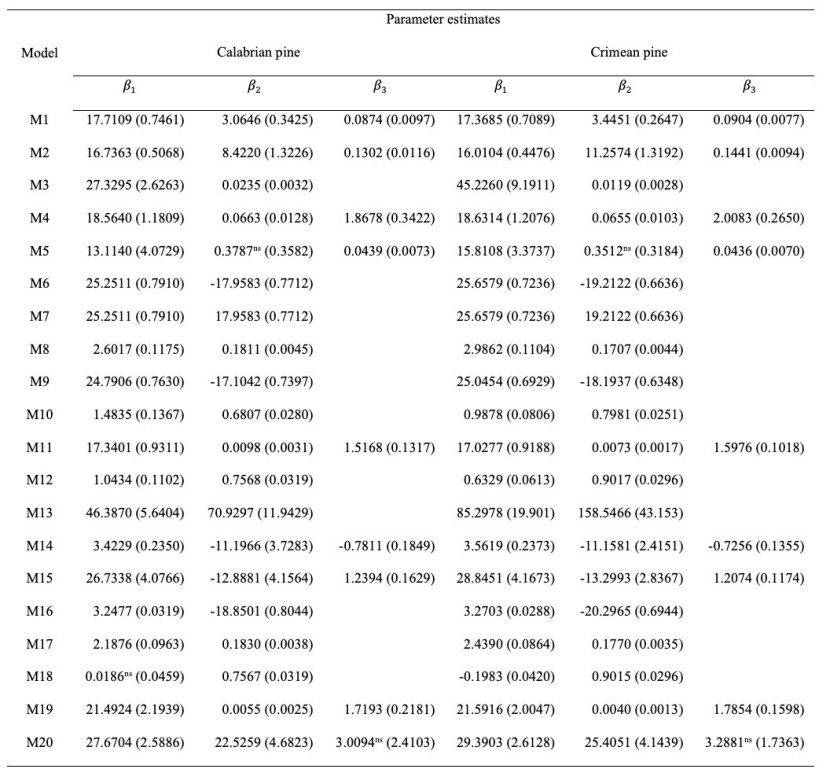
Table 3: Parameter estimates and in parentheses associated standard errors for models fitted. “ns” shows nonsignificant results at the 0.05 level. / Tabelle 3: Modellparameter und in Klammern deren Standardfehler für die getesteten Modelle. „ns“ zeigt nicht signifikante Ergebnisse auf Niveau von 0.05 an.
Goodness-of-fit statistics including adjusted coefficient of determination, bias, absolute mean deviation, and root mean square error for each tree species and for each of the twenty models are given in Table 4. All the models seem to fit well, explaining 76-79% and 81-84% of the total variance in h–d relationships of Calabrian pine and Crimean pine, respectively. Besides, RMSEs were calculated between 1.7726 and 1.8948 for Calabrian pine and between 1.6862 and 1.8048 for Crimean pine.
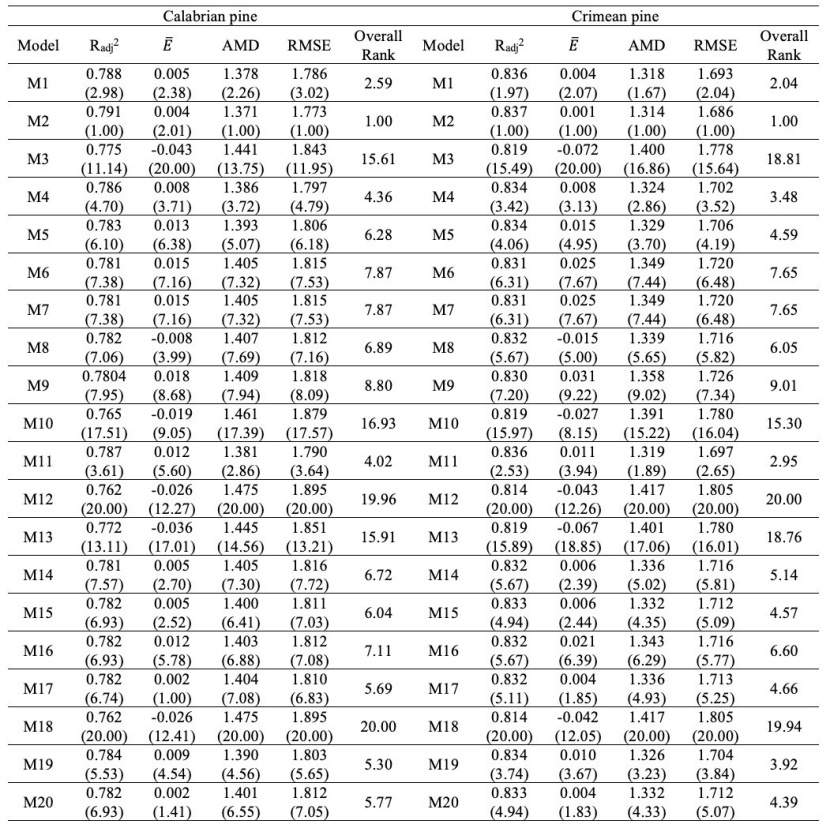
Table 4: Goodness-of-fit statistics (and relative ranks) of the fitted models. For abbrevations please see text. / Tabelle 4: Statistiken zur Anpassungsgüte und Rangfolge der getesteten Modelle. Für Abkürzung siehe Text.

Figure 3: Plots of observed and estimated heights and residuals versus estimated heights and diameters at breast height for Calabrian pine (a, c and e) and Crimean pine (b, d and f) for model M2. / Abbildung 3: Darstellung der beobachteten und der geschätzten Höhe (a, b), der Residuen versus geschätzten Höhe (c, d) und der Residuen versus Brusthöhendurchmesser (e, f) für Kalabrische Kiefer (a, c, e) und Schwarzkiefer (b, d, f) für Modell M2.
Relative ranks of each evaluation statistics by tree species are also seen in Table 4. According to overall ranks, M2 which is logistic type and 3-parameter h-d model suggested by Pearl and Reed (1920) was found superior for Calabrian pine (overall rank of 1.00) and Crimean pine (overall rank of 1.00). Besides, M18 (overall rank of 20.00) and M12 (overall rank of 20.00) were the worst models.
Patterns of residuals for estimated heights by the best model (M2) and the plots of observed and estimated heights were drawn (Figure 3). As seen in the figure, the model ensured indiscriminate patterns of residuals around zero with homogenous variance for both species. However, after high values of predicted Calabrian pine, the variation of biases was a bit higher for possible reason of the number of tall sample trees is less than the number of sample trees in other height classes.
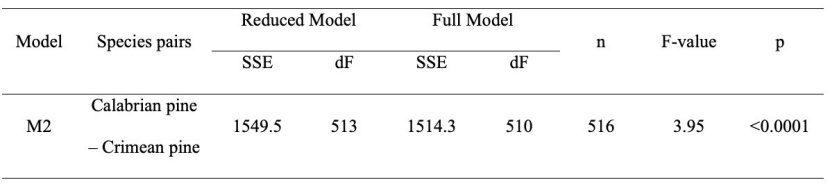
Table 5: Analysis of statistical difference between the two studied species using the nonlinear extra sum of squares test for model M2. / Tabelle 5: Analyse des statistisch signifikanten Unterschiedes zwischen den zwei untersuchten Baumarten mittels nonlinear extra sum of squares Tests für Modell M2.
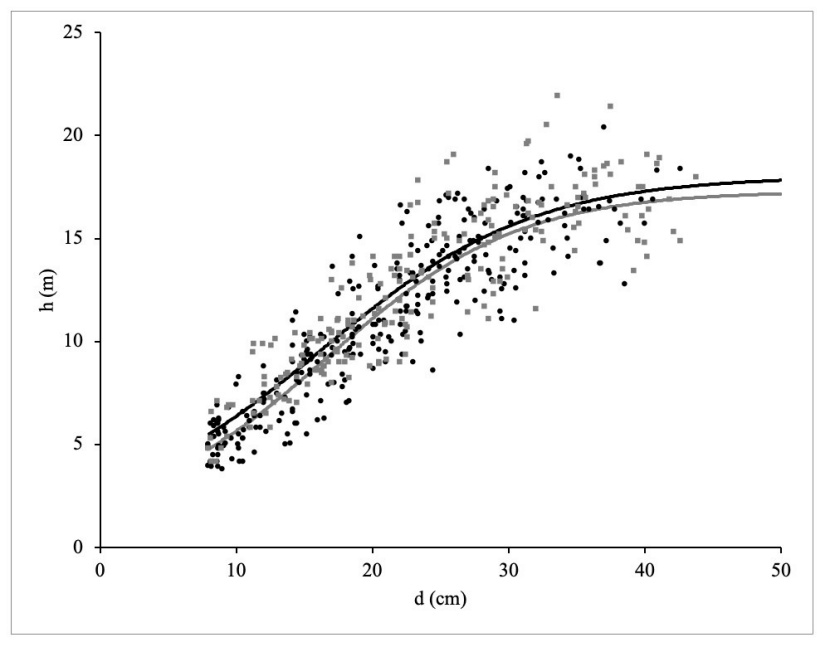
Figure 4: Scatter plot of observed tree height (h) against diameter at breast height (d). Curves fitted with model M2 are drawn along with observations. Black and gray colors represent Calabrian pine and Crimean pine (modeling data sets), respectively. / Abbildung 4: Streudiagramm von Baumhöhe und Brusthöhendurchmesser. Kurven zeigen Ergebnisse von Modell M2 an. Schwarze Punkte und graue Punkte zeigen jeweils die Daten für Kalabrische Kiefer und Schwarzkiefer.
According to goodness-of-fit statistics, M2 showed the best results for both species. The nonlinear extra sum of squares method, executed using M2, indicated significant difference (p<0.0001) in h-d relationship between the species (Table 5). The graphical representation of the height trends of the species in the M2 based on fitting data set is shown by Figure 4. The height growth of Calabrian pine is higher in all diameter classes compared to Crimean pine. Differences between the measured and estimated height values by M2 were compared using validation data set and paired–samples t-test. The estimated and measured height values were found statistically same (p>0.05) for the both species.
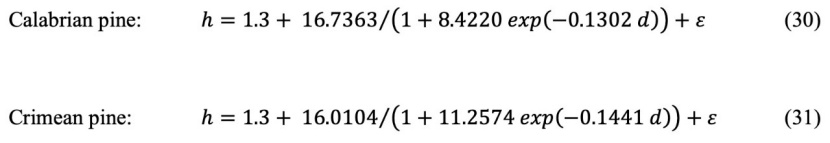
The final mathematical forms of the M2 for both species are given as follows:
4 Discussion
4.1 Comparison between developed h-d models and models in the literature
Due to ecological and economic importance of pine species used in this study, some studies have been carried out to investigate the h-d relationships of Calabrian pine (Özçelik and Çapar, 2014; Özçelik et al., 2014; Carus and Çatal, 2017; Çatal and Carus, 2018) and Crimean pine (Çatal, 2012; Özçelik et al., 2014; Ercanlı, 2020; Seki and Sakici, 2022a). Some of the models developed in these previous studies, covering different regions of Türkiye and local areas, are simple models containing only d or generalized models including stand variables in addition to d. As in this study, only simple models with d as a predictor variable were selected for comparison. Height–diameter curves developed in this study were compared with the previous curves graphically (Figure 5). The height curve fitted for Calabrian pine in this study (Figure 5a) is quite different from the curves fitted for Calabrian pine stands in different regions (Özçelik et al., 2014; Carus and Çatal, 2017). It should be noted here that the parameters of Özçelik et al. (2014) curve were obtained based on the ecoregion which is more familiar to Cemaller region. When the paired sample t-test was applied for measured height values (validation data set) and estimated height values by M2 and previous models developed for different regions, M2 showed the satisfactory and acceptable results (p>0.05). However, height estimations by the other models were found statistically different from observed ones (p<0.05).
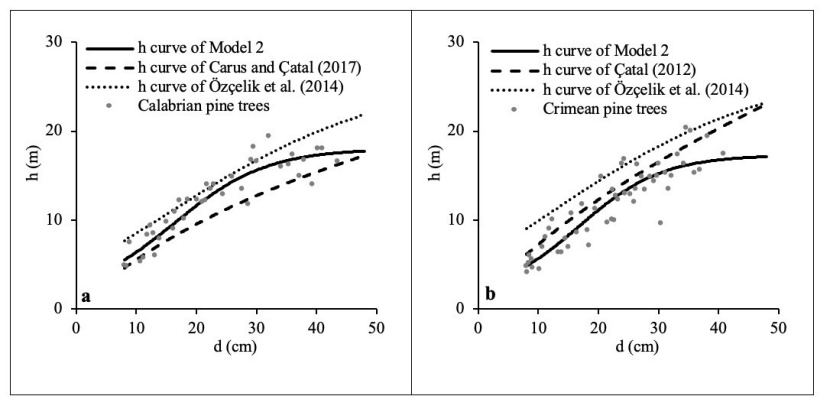
Figure 5: Comparison of h-d curves for Calabrian pine (a) and Crimean pine (b) obtained from Model 2 (this study) and published studies. Grey dots represent validation data of this study. / Abbildung 5: Vergleich der h-d-Kurven für kalabrische Kiefer (a) und Schwarzkiefer (b) von Modell 2 (diese Studie) und publizierte Studien. Graue Punkte zeigen Validierungsdaten dieser Studie.
Figure 5 shows that the curve fitted for Crimean pine in this study differs considerably from the curves of the other two studies (Çatal, 2012; Özçelik et al., 2014). Crimean pine stands examined in this study have not optimal conditions for the ecological demands of this species, in compared with the others. Crimean pine individuals examined in this study have a rather lower height growth potential than the individuals examined in the other two studies. Even though Crimean pine can grow up to 30-40 m in height under optimal conditions (Farjon, 2010; Seki and Sakici, 2017), Crimean pines examined in this study had maximum about 20 m height in Cemaller region. Therefore, it can be concluded that study area with altitude ranges of 572 and 673 m does not ensure optimal conditions for Crimean pine height growth. Besides, Özçelik et al. (2014), Seki and Sakici (2022a, 2022b) reported that there were significant differences of h-d relationship and growth rates of Calabrian and Crimean pines among the ecologically different regions. Therefore, it is not surprising that the growth trends and allometric relationships of trees that spread in geographies with quite different ecological characteristics differ from each other. In addition, differences in model forms used in previous studies and used in this study are also one of the potential main reasons for this diversity.
It is not surprising that the curves fitted in previous studies conducted in the southern regions of Türkiye differ from the curve fitted in this study conducted in the northern part of Türkiye. Moreover, it is a well-known fact that climate, management history, nature and range of data used for modeling, site characteristics (e.g., especially site productivity) of the sampled forest stands influence tree allometry and growth dynamics (Baral et al., 2022; Koulelis et al., 2022; Seki and Sakici, 2022b; Wu et al., 2022). The sampled stands of this study consist of natural forests, while Calabrian pine (Carus and Çatal, 2017) and Crimean pine (Çatal, 2012) stands investigated in the previous studies consisted of planted forests. Differences in growth potentials of the trees growing in natural and planted sites are expected fact. Also, fitting data of Carus and Çatal (2017) consisted of maximum d of 30.1 cm for Calabrian pine, and Çatal (2012) used maximum d of 25.0 cm for Crimean pine. This difference of data set used in existing study and the previous ones might be one of the most effective factor differentiating the shape of curves after these diameter classes. Besides, the curve of Carus and Çatal (2017) showed lower height growth patterns in compared with this study. Considering that the Calabrian pine stands sampled by these researchers were located at an average altitude of 1150 m and this average is quite high for potential growth of this tree species, this situation seems normal. Çatal (2012) sampled the higher productive Crimean pine forest stands in compared with this study. And this situation naturally led to the height growth of the stands investigated by this researcher being higher than that of this study.
Comparing with this study, the curves of Calabrian pine and Crimean pine developed by Özçelik et al. (2014) showed higher height growth potential. Mean annual precipitation of the region where Özçelik et al. (2014) studied ranges from 604 to 1241 mm, while it ranges between 400 and 800 mm in Cemaller region. These differences in precipitation of two regions could be considered one of the major factors effecting the curves fitted in existing study and fitted by Özçelik et al. (2014). Because, precipitation is one of the key factors positively affecting tree growth (Mondek et al., 2021; Koulelis et al., 2022), and high rainfall in the previous study area may have provided better growing conditions for the Crimean pine stands located there.
4.2 Robustness of the developed h–d models
In this study, twenty different h-d models were fitted and evaluated for Calabrian pine and Crimean pine. Most of the models showed satisfying results. However, M2 suggested by Pearl and Reed (1920) was selected as the best predictive model according to ranking system. The fitted model ensured biologically realistic shape such as S-shaped which is also suggested by Yuancai and Parresol (2001). The fitted model can be used by practitioners and forest managers to obtain accurate height estimates for these species located in the Cemaller region. Especially, the use of these models does not require any additional measurements other than diameter at breast height of the subject trees.
As in this study, robustness of the logistic type h-d model suggested by Pearl and Reed (1920) has been proven in many studies. This model was found superior to its counterparts for Tatarian maple in Hungary (Misik et al., 2016), Scots pine in a wide range of ecological zones (Mehtätalo et al., 2015), Velvet maple in Iran (Navroodi et al., 2016), gmelina in Nigeria (Ogana, 2018), Maritime pine in Spain (Ogana et al., 2020). However, in some studies, this model has not been found superior enough in compared with its counterparts (Mugasha et al., 2013; Deng et al., 2019). This situation would imply that the performance of a function is linked with model capability of capturing the variation in the ecological system of the study area of the data. Therefore, choosing a suitable function which would fit data well is the first step of modeling studies.
4.3 Usage of the developed models
Height-diameter models are of great importance in reducing inventory cost and labor. These models, which basically have two types, simple (including d as an independent variable) and generalized (including d and stand characteristics as independent variables), allow forest practitioners to accurately predict tree height. Simple h-d models like the one developed in this study allow estimation of h with only d measurements. Especially for h predictions in small regions with homogeneous stand characteristics, it would be more appropriate to use simple models that do not require additional measurements. The h-d models developed in this study can be used in the Cemaller region, and they are not suitable to be used in different regions. Namely, these models should not be used for h estimation of individuals that are located in high productive forest stands. In case of using these models for different regions a new validation will be required.
Acknowledgement
The author would like to thank Hamza Karail, Özhan Batuhan Akgün and Salih Berat Pınarbaşı for their field support and help in data collection.
Disclosure statement
No potential conflict of interest was reported by the author.
Funding
This study was supported by Scientific Research Projects Management Coordinator of Karabük University, under the grant number KBÜBAP-21-ABP-107.
References
Alemdağ Ş., 1962. Türkiye’deki kızılçam ormanlarının gelişimi, hasılatı ve amenajman esasları. Forestry Research Institute Publication, Ankara (in Turkish).
Baral S., Neumann M., Basnyat B., Gauli K., Gautam S., Bhandari S.K., Vacik H., 2020. Form factors of an economically valuable Sal tree (Shorea robusta) of Nepal. Forests, 11(7): 754. https://doi.org/10.3390/f11070754
Baral S., Neumann M., Basnyat B., Sharma R.P., Silwal R., Shrestha H.L., Vacik H., 2022. Volume functions for Shorea robusta Gaertn. in Nepal. Forestry, 95(3): 405–415. https://doi.org/10.1093/forestry/cpab050
Bates D.M., Watts D.G., 1980. Relative curvature measures of nonlinearity. Journal of the Royal Statistical Society: Series B (Methodological) 42(1): 1–25. doi.org/10.1111/j.2517-6161.1980.tb01094.x
Bhandari S.K., Veneklaas E.J., McCaw L., Mazanec R., Whitford K., Renton M., 2021. Effect of thinning and fertilizer on growth and allometry of Eucalyptus marginata. Forest Ecology and Management, 479: 118594.
Bolat F., Ülker O., Günlü A., 2022. Nonlinear height-diameter models for Hungarian oak (Quercus frainetto Ten.) in Dumanlı Forest Planning Unit, Çanakkale/Turkey. Austrian Journal of Forest Science 139(3): 199–220.
Burkhart H.E., Strub M.R., 1974. A model for simulation of planted loblolly pine stands. In Growth models for tree and stand simulation. Royal College of Forestry, Stockholm, Sweden. pp. 128–135.
Cabo C., Del Pozo S., Rodriguez-Gonzalvez P., Ordonez C., GonzalezAguilera D., 2018. Comparing terrestrial laser scanning (TLS) and wearable laser scanning (WLS) for individual tree modeling at plot level. Remote Sensing 10: 540-556.
Calama R., Montero G., 2004. Interregional nonlinear height diameter model with random coefficients for stone pine in Spain. Canadian Journal of Forest Research 34(1): 150–163. doi.org/10.1139/x03-199
Carus S., Çatal Y., 2017. Comparison of some diameter-height models for brutian pine (Pinus brutia Ten.) afforestations in Ağlasun region. Turkish Journal of Forestry 18(2): 94–101 (in Turkish). doi.org/10.18182/tjf.289330
Carus S., Akguş Y., 2018. Development of diameter-height models for stone pine (Pinus pinea L.) stands in Tarsus region. Turkish Journal of Forestry 19(1): 1–8 (in Turkish).
Clutter J.L., Fortson J.C., Pienaar L.V., Brister G.H., Bailey R.L., 1983. Timber management: a quantitative approach. New York, NY: John Wiley. 333 p.
Corral Rivas J.J., González J.G.Á., González A.D.R., von Gadow K., 2004. Compatible height and site index models for five pine species in El Salto, Durango (Mexico). Forest Ecology and Management 201(2–3): 145–160. doi.org/10.1016/j.foreco.2004.05.060
Curtis R.O., 1967. Height-diameter and height-diameter-age equations for second-growth Douglas-fir. Forest Science 13(4): 365–375. doi.org/10.1093/forestscience/13.4.365
Curtis R.O., Clendenan G., DeMars D.J., 1981. A new stand simulator for coast douglas-fir: DFSIM users guide. USDA Forest Service General Technical Report, PNW–128., Portland.
Çatal Y., 2012. Height-diameter model for black locust, Anatolian black pine and Taurus cedar tree species in Lakes Region. SDU Faculty of Forestry Journal 13: 92–96 (in Turkish).
Çatal Y., Carus S., 2018. A height-diameter model for brutian pine (Pinus brutia Ten.) plantations in southwestern Turkey. Applied Ecology and Environmental Research 16(2): 1445–1459. dx.doi.org/10.15666/aeer/1602_14451459
Deng C., Zhang S., Lu Y., Froese R.E., Ming A., Li Q., 2019. Thinning effects on the tree height–diameter allometry of Masson pine (Pinus massoniana Lamb.). Forests 10(12): 1129. doi.org/10.3390/f10121129
Ercanlı İ., 2015. Nonlinear mixed effect models for predicting relationships between total height and diameter of oriental beech trees in Kestel, Turkey. Revista Chapingo Serie Ciencias Forestales y del Ambiente 21(2): 185–202.
Ercanlı İ., 2020. Innovative deep learning artificial intelligence applications for predicting relationships between individual tree height and diameter at breast height. Forest Ecosystems 7(1): 1–18. doi.org/10.1186/s40663-020-00226-3
Farjon A., 2010. A Handbook of the World’s Conifers. Brill Academic Publishers. 1,112 p.
GDF, 2015. Forest management plan of Karadere (divided into Karadere and Cemaller in 2020) planning unit. General Directorate of Forestry of Turkey, Ankara.
GDF, 2021. Forestry statistics 2021. General Directorate of Forestry Publications, Ankara.
Gompertz B., 1825. On the nature of the function expressive of the law of human mortality, and on a new mode of determining the value of life contingencies. Philosophical Transactions of the Royal Society of London 115: 513–585. doi.org/10.1098/rstl.1825.0026
Han Y., Lei Z., Ciceu A., Zhou Y., Zhou F., Yu D., 2021. Determining an accurate and cost-effective individual height-diameter model for Mongolian pine on sandy land. Forests 12(9): 1144. doi.org/10.3390/f12091144
Huang S., Titus S.J., Wiens D.P., 1992. Comparison of nonlinear height–diameter functions for major Alberta tree species. Canadian Journal of Forest Research 22(9): 1297–1304. doi.org/10.1139/x92-172
Huang S., Price D., Titus S.J., 2000. Development of ecoregion-based height-diameter models for white spruce in boreal forests. Forest Ecology and Management 129(1–3): 125–141. doi.org/10.1016/S0378-1127(99)00151-6
Kalıpsız A., 1963. Türkiye’de karaçam meşcerelerinin tabii büyümesi ve verim kudreti üzerine araştırmalar. General Directorate of Forestry Publications, Istanbul (in Turkish).
Koulelis P., Daskalakou E., Mihopoulos P., 2018. Testing non-linear height-diameter functions for three native trees of Greece on ICP forests Level II plots. Austrian Journal of Forest Science 135(4): 297–314.
Koulelis P., Fassouli V., Petrakis P., Ioannidis K., Alexandris S., 2022. The impact of selected climatic factors on the growth of Greek fir on Mount Giona in mainland Greece based on tree ring analysis. Austrian Journal of Forest Science 139(1): 1–30.
Larson B.C., 1986. Development and growth of even-aged stands of Douglas-fir and grand fir. Canadian Journal of Forest Research 16(2): 367–372. https://doi.org/10.1139/x86-063
Lebedev A.V., 2020. New generalised height-diameter models for the birch stands in European Russia. Baltic Forestry 26(2): 1–7. doi.org/10.46490/BF499
Loetsch F., Haller K.E., Zöhrer F., 1973. Forest Inventory, Vol II. BLV Verlagsgesellschaft, 469 p.
Mäkelä, H., Pekkarinen, A., 2004. Estimation of forest stand volumes by Landsat TM imagery and stand-level field-inventory data. Forest Ecology and Management 196(2-3): 245–255. https://doi.org/10.1016/j.foreco.2004.02.049
Mehtätalo L., de-Miguel S., Gregoire T.G., 2015. Modeling height-diameter curves for prediction. Canadian Journal of Forest Research 45(7): 826–837. doi.org/10.1139/cjfr-2015-0054
Meyer H.A., 1940. A mathematical expression for height curves. Journal of Forestry 38(5): 415–420. doi.org/10.1093/jof/38.5.415
Meyer V., Saatchi S.S., Chave J., Dalling J.W., Bohlman S., Fricker G.A., Robinson C., Neumann M., Hubbell S., 2013. Detecting tropical forest biomass dynamics from repeated airborne lidar measurements. Biogeosciences 10(8): 5421–5438. https://doi.org/10.5194/bg-10-5421-2013
Misik T., Antal K., Kárász I. Tóthmérész B., 2016. Nonlinear height–diameter models for three woody, understory species in a temperate oak forest in Hungary. Canadian Journal of Forest Research 46(11): 1337–1342. doi.org/10.1139/cjfr-2015-0511
Misir N., 2010. Generalized height-diameter models for Populus tremula L. stands. African Journal of Biotechnology 9(28): 4348–4355.
Mondek J., Matějka K., Gallo J., Prokůpková A., Hájek V., 2021. Picea abies and Pseudotsuga menziesii radial growth in relation to climate: case study from South Bohemia. Austrian Journal of Forest Science 138(3): 209–244.
Mugasha W.A., Bollandsås O.M., Eid T., 2013. Relationships between diameter and height of trees in natural tropical forest in Tanzania. Southern Forests: a Journal of Forest Science 75(4): 221–237. doi.org/10.2989/20702620.2013.824672
Narin Ö.G., Vatandaşlar C., Abdikan S., 2022. Estimating Stand Top Height Using Freely Distributed ICESat-2 LiDAR Data: A Case Study from Multi-species Forests in Artvin. Forestist 72(3): 294–298. doi.org/10.5152/forestist.2022.21044
Navroodi I.H., Alavi S.J., Ahmadi M.K., Radkarimi M., 2016. Comparison of different non-linear models for prediction of the relationship between diameter and height of velvet maple trees in natural forests (Case study: Asalem Forests, Iran). Journal of Forest Science 62(2): 65–71. doi.org/10.17221/43/2015-JFS
Ogana F.N., 2018. Comparison of a modified log-logistic distribution with established models for tree height prediction. Journal of Research in Forestry, Wildlife and Environment 10(2): 49–55.
Ogana F.N., Corral-Rivas S., Gorgoso-Varela J.J., 2020. Nonlinear mixed-effect height-diameter model for Pinus pinaster Ait. and Pinus radiata D. Don. Cerne 26(1): 150–161. doi.org/10.1590/01047760202026012695
Özçelik R., Çapar C., 2014. Developing generalized height-diameter models for natural brutian pine stands in Antalya district. SDU Faculty of Forestry Journal 15: 44–52 (in Turkish). doi.org/10.18182/tjf.01926
Özçelik R., Dirican O., 2017. Individual taper models for natural cedar and Taurus fir mixed stands of Bucak Region, Turkey. Journal of the Faculty of Forestry Istanbul University 67(2): 243–261. doi.org/10.17099/jffiu.290845
Özçelik R., Yavuz H., Karatepe Y., Gürlevik N., Kiriş R. 2014. Development of ecoregion-based height-diameter models for 3 economically important tree species of southern Turkey. Turkish Journal of Agriculture and Forestry 38(3): 399–412. doi.org/10.3906/tar-1304-115
Pearl R., Reed L.J., 1920. On the rate of growth of the population of the United States since 1790 and its mathematical representation. Proceedings of the National Academy of Sciences 6(6): 275–288. doi.org/10.1073/pnas.6.6.275
Pillsbury N.H., McDonald P.M., Simon V. 1995. Reliability of tanoak volume equations when applied to different areas. Western Journal of Applied Forestry 10(2): 72–78. doi.org/10.1093/wjaf/10.2.72
Poudel K.P., Cao Q.V., 2013. Evaluation of methods to predict Weibull parameters for characterizing diameter distributions. Forest Science 59(2): 243–252. doi.org/10.5849/forsci.12-001
Ratkowsky D.A., 1990. Handbook of nonlinear regression. Marcel Dekker, Inc., New York.
Ratkowsky D.A., Reedy T.J. 1986. Choosing near-linear parameters in the four-parameter logistic model for radioligand and related assays. Biometrics 42: 575–582. doi.org/10.2307/2531207
Richards F.J., 1959. A flexible growth function for empirical use. Journal of Experimental Botany 10(2): 290–301. doi.org/10.1093/jxb/10.2.290
Rodríguez F., Pemán J., Aunós Á., 2010. A reduced growth model based on stand basal area. A case for hybrid poplar plantations in northeast Spain. Forest Ecology and Management 259(10): 2093–2102. doi.org/10.1016/j.foreco.2010.02.021
SAS Institute Inc., 2004. SAS/ETS® 9.1 User’s guide. Cary (NC): SAS Institute Inc.
Schreuder H.T., Hafley W.L., Bennett F.A., 1979. Yield prediction for unthinned natural slash pine stands. Forest Science 25(1): 25–30. doi.org/10.1093/forestscience/25.1.25
Seki M., Sakici O.E., (2017). Dominant height growth and dynamic site index models for Crimean pine in the Kastamonu-Taşköprü region of Turkey. Canadian Journal of Forest Research 47(11): 1441–1449. https://doi.org/10.1139/cjfr-2017-0131
Seki M., Sakici O.E., 2022a. Ecoregion-based height-diameter models for Crimean pine. Journal of Forest Research 27(1): 36-44. doi.org/10.1080/13416979.2021.1972511
Seki M., Sakici O.E., 2022b. Ecoregional Variation of Crimean Pine (Pinus nigra subspecies pallasiana [Lamb.] Holmboe) Stand Growth. Forest Science 68(5–6): 452–463. https://doi.org/10.1093/forsci/fxac030
Sharma M., 2016. Comparing height-diameter relationships of boreal tree species grown in plantations and natural stands. Forest Science 62(1): 70–77. doi.org/10.5849/forsci.14-232
Sibbesen E., 1981. Some new equations to describe phosphate sorption by soils. Journal of Soil Science 32(1): 67–74. doi.org/10.1111/j.1365-2389.1981.tb01686.x
Sonmez T., 2009. Generalized height-diameter models for Picea orientalis L. Journal of Environmental Biology 30(5): 767–772.
Stage A.R., 1975. Prediction of height increment for models of forest growth. USDA For. Serv. Res. Pap. INT-164.
Strand L., 1959. The accuracy of some methods for estimating volume and increment on sample plots. Medd. norske Skogsforsøksvesen 15(4): 284–392. (in Norwegian with English summary)
Subedi T., Bhandari S.K., Pandey N., Timilsina Y.P., Mahatara D., 2021. Form factor and volume equations for individual trees of Shorea robusta in Western low land of Nepal. Austrian Journal of Forest Science 138(3): 143–166.
Sun S., Cao Q.V., Cao T., 2019. Characterizing diameter distributions for uneven-aged pine-oak mixed forests in the Qinling Mountains of China. Forests 10(7): 596. doi.org/10.3390/f10070596
Temesgen H., Gadow K.V., 2004. Generalized height-diameter models – an application for major tree species in complex stands of interior British Columbia. European Journal of Forest Research 123(1): 45–51. doi.org/ 10.1007/s10342-004-0020-z
van Laar A., Akça A. 2007. Forest mensuration. Germany: Goettingen.
Vargas-Larreta B., Castedo-Dorado F., Álvarez-González J.G., Barrio-Anta M., Cruz-Cobos F., 2009. A generalized height–diameter model with random coefficients for uneven-aged stands in El Salto, Durango (Mexico). Forestry 82(4): 445–462. doi.org/10.1093/forestry/cpp016
Vatandaşlar C., Zeybek M., 2021. Extraction of forest inventory parameters using handheld mobile laser scanning: A case study from Trabzon, Turkey. Measurement 177: 109328. https://doi.org/10.1016/j.measurement.2021.109328
Vatandaşlar C., Zeybek M., 2020. Application of handheld laser scanning technology for forest inventory purposes in the NE Turkey. Turkish Journal of Agriculture and Forestry 44(3): 229–242.
Weiskittel A.R., Hann D.W., Kershaw Jr J.A., Vanclay J.K., 2011. Forest growth and yield modeling. Wiley-Blackwell, West Sussex, UK, p. 424.
Williams M.S., Bechtold W.A., LaBau V.J., 1994. Five instruments for measuring tree height: An evaluation. Southern Journal of Applied Forestry 18(2): 76–82.
Wu H., Xu H., Tang F., Ou G.L., Liao Z.Y., 2022. Impacts of stand origin, species composition, and stand density on height-diameter relationships of dominant trees in Sichuan Province, China. Austrian Journal of Forest Science 139(1): 51–72.
Wykoff W.R., Crookston N.L., Stage A.R., 1982. User’s guide to the stand prognosis model. US Forest Service General Technical Report INT 133. US Department of Agriculture, Intermountain Forest and Range Experiment Station, Ogden, UT. USA.
Yang R.C., Kozak A., Smith J.H.G., 1978. The potential of Weibull-type functions as flexible growth curves. Canadian Journal of Forest Research 8(4): 424–431. https://doi.org/10.1139/x78-062
Yuancai L., Parresol B.R., 2001. Remarks on height-diameter modeling (Vol. 10). US Department of Agriculture, Forest Service, Southern Research Station.
Yücesan Z., Özçelik S., Oktan E., 2015. Analysis of release cutting effects on increment and growth in Oriental beech (Fagus orientalis Lipsky) stand. Journal of Environmental Biology 36(5): 1075–1082.
Zeybek M., Vatandaşlar C., 2021. An automated approach for extracting forest inventory data from individual trees using a handheld mobile laser scanner. Croatian Journal of Forest Engineering: Journal for Theory and Application of Forestry Engineering 42(3): 515–528. https://doi.org/10.5552/crojfe.2021.1096


