Schlüsselbegriffe: Allometrie, Baumdimensionen, Autokorrelation, Heteroskedastizität, Forstwirtschaft, Waldinventur
Abstract
The measurement of tree heights is a tedious task and highly time intensive. Tree heights are closely linked to tree diameters that are measured simply. Therefore, total tree height is commonly predicted as a function of its diameter. In this study, two-, three-, and four-parameter height-diameter (H-D) models including only tree diameter as the independent variable were developed using a total of 470 observations. The results showed that the models were accurate with good fit indices. The modified von Bertalanffy model had the best predictive performance with an Radj2 of 0.80. The characteristics of the predictions were found to be consistent with biological expectations. The residuals by the models were distributed normally and independently. Consequently, the nonlinear H-D models developed can reliably be used for predicting the heights of Hungarian oak (Quercus frainetto Ten.) trees in Dumanlı Forest Planning Unit, Çanakkale/Turkey. In addition, height-diameter relations may be influenced by stand conditions. Therefore, the nonlinear H-D models developed may have a limitation when they will be used in the outside of study area.
Zusammenfassung
Direkte Baumhöhenmessungen im Feld sind kostspielig und zeitaufwendig. Baumhöhe korreliert eng mit Stammdurchmessern, die leichter zu messen sind. Daher wird Baumhöhe häufig als Funktion des Stammdurchmessers geschätzt. In dieser Studie entwickeln wir zwei-, drei- und vierparametrige Höhen-Durchmesser-Modelle mithilfe von 470 beobachteten Bäumen. Unsere Ergebnisse zeigen, dass alle Modelle mit guter Anpassung an die Beobachtungen akkurat sind. Das modifizierte Bertalanffy-Modell hat die beste Performance mit einem Radj2 von 0.80. Die Muster der Schätzfunktionen waren konsistent mit biologischen Erwartungen. Die Residuen waren normalverteilt und unabhängig. Die entwickelten Höhen-Durchmesser-Modelle erscheinen zuverlässig für die Schätzung von Baumhöhen bei Ungarischer Eiche im Forstbetrieb Dumanlı, Çanakkale/Türkei. Höhen-Durchmesser-Beziehungen werden durch Bestandesbedingungen beeinflusst. Daher ist eine Anwendung der hier entwickelten nichtlinearen Modelle außerhalb des Untersuchungsgebietes kritisch zu beurteilen.
1 Introduction
Tree height is a key variable in modeling forest attributes such as individual tree volume (Subedi et al., 2021), tree biomass (Ledermann and Gschwantner, 2006), and tree carbon content (Thurnher et al., 2013). Inclusion of tree height to the individual-tree and the whole-stand models improves their accuracy and adaptability. In addition, an intense field sampling effort is needed for accurately measuring tree heights. Therefore, in general, the functional allometric relationships between tree diameters and tree heights are established for predicting tree heights that are not measured in the forest inventory study. Because the measurement of tree diameter is relatively easy, and it can be obtained with a high degree of accuracy (Yang and Burkhart, 2020).
The H-D models have been developed for various tree species in Turkey, for instance, by Sönmez (2009) for Oriental spruce (Picea orientalis L.), by Mısır (2010) for Anatolia trembling aspen (Populus tremula L.), by Diamantopoulou and Özçelik (2012) for Taurus cedar (Cedrus libani A. Rich.), Cilicica fir (Abies cilicica Carr.) and Brutian pine (Pinus brutia Ten.), by Özçelik et al. (2013) for Crimean juniper (Juniperus excels Bieb), by Özçelik et al. (2014) for Brutian pine, Black pine (Pinus nigra Arnold) and Taurus cedar, by Ercanlı (2015) for Oriental beech (Fagus orientalis Lipsky), by Özdemir and Saraçoğlu (2016) for Oak stands (i.e., Sessile oak [Quercus petraea [Matt.] Liebl.], Hungarian oak [Quercus frainetto Ten.] and Turkey oak [Quercus cerris L.]), by Karatepe et al. (2022) for Taurus cedar plantation and by Seki and Sakıcı (2022) for Black pine. In Europe, America and Asia, H-D models have been developed by Lynch et al. (2005) for Cherrybark Oak (Quercus pagoda Raf.) in southeastern of United States, by Adame et al. (2008) for Pyrenean oak (Quercus pyrenaica Willd.) in northwest of Spain, by Paulo et al. (2011) for Cork oak (Quercus suber L.) in Portugal, by Koulelis et al. (2018) for Hungarian oak, European beech (Fagus sylvatica L.) and Bulgarian fir (Abies borissi-regis Mattf.) in Greece, by Ogana and Gorgoso-Varela (2020) for Maritime pine (Pinus pinaster Ait) in northwest of Spain, by Vanderschaaf (2020) for Loblolly pine (Pinus taeda L.), Longleaf pine (Pinus palustris P. Mill.), Shortleaf pine (Pinus echinata Mill.) and Slash pine (Pinus elliottii Engelm.) in Louisiana, Mississippi, and Texas in United States, by Raptis et al. (2021) for Black pine in Greece and by Wu et al. (2022) for various tree species (e.g., Brown oak [Quercus semecarpifolia Sm.] and Blue Japanese oak [Quercus glauca Thunb.]) in Sichuan Province, China, by Skudnik and Jevšenak (2022) for various tree species (e.g., European beech, Norway spruce [Picea abies Karst], Sessile oak and Turkey oak) in Slovenia.
The literature suggests that the nonlinear models are flexible, interpretable, and robust (Archontoulis and Miguez, 2015), and thus they are commonly used in modeling tree heights. Huang et al. (1992) developed linear and nonlinear H-D models for predicting various tree species’ heights. Huang et al. (2000) established the nonlinear H-D models for White spruce (Picea glauca [Moench] Voss) in different ecoregions. Similarly, Seki and Sakici (2022) built the generalized nonlinear H-D models by considering the ecoregion effects for Crimean pine (Pinus nigra subsp. pallasiana [Lamb.] Holmboe). Ogana and Ercanli (2022) developed a generalized nonlinear H-D model derived from the Meyer model using a large dataset composed by a total of 1,736 observations from many tree species. The nonlinear models have some advantages, providing a trajectory exhibiting positive slope across the range of the observed data, inflection point and asymptote. Therefore, they can competently provide the predictions that are compatible with the biological realism expressed in the study of Yuancai and Parresol (2001). For instance, Adame et al. (2008) evidenced the sigmoidal pattern for height-diameter relationships when they used the nonlinear model having two parameters. Ng’andwe et al. (2019) achieved the predictions that are in agreement with the S-shaped pattern using the logistic-type nonlinear H-D model.
In Turkey, the forest lands have been managed considering multiple ecosystem services since the last twenty-two years (Zengin et al., 2013). Furthermore, according to the forestry statistics (URL-1, 2020), the amount of wood-based forest products increases more every year in Turkey due to more forest lands under management. Therefore, it is necessary to develop forest growth and yield models for sustainable management of the forest lands. H-D models are important for accurate predictions of forest yield and growth (Özçelik et al., 2018; Temesgen et al., 2007).
There are eighteen subspecies of Oak in Turkey and they occupy 29% (approximately 6.7 million hectares) of the total forest land in Turkey (URL-1, 2020). However, there is very little information on their height-diameter relationships. According to our knowledge, a H-D model is not yet available for Hungarian oak stands in Dumanlı Forest Planning Unit in Çanakkale region. The objective of this study was to evaluate nonlinear H-D models by using the goodness-of-fit statistics and by analyzing the characteristics of the residuals and hence to identify the most appropriate model for Hungarian oak stands in the study area.
2 Material
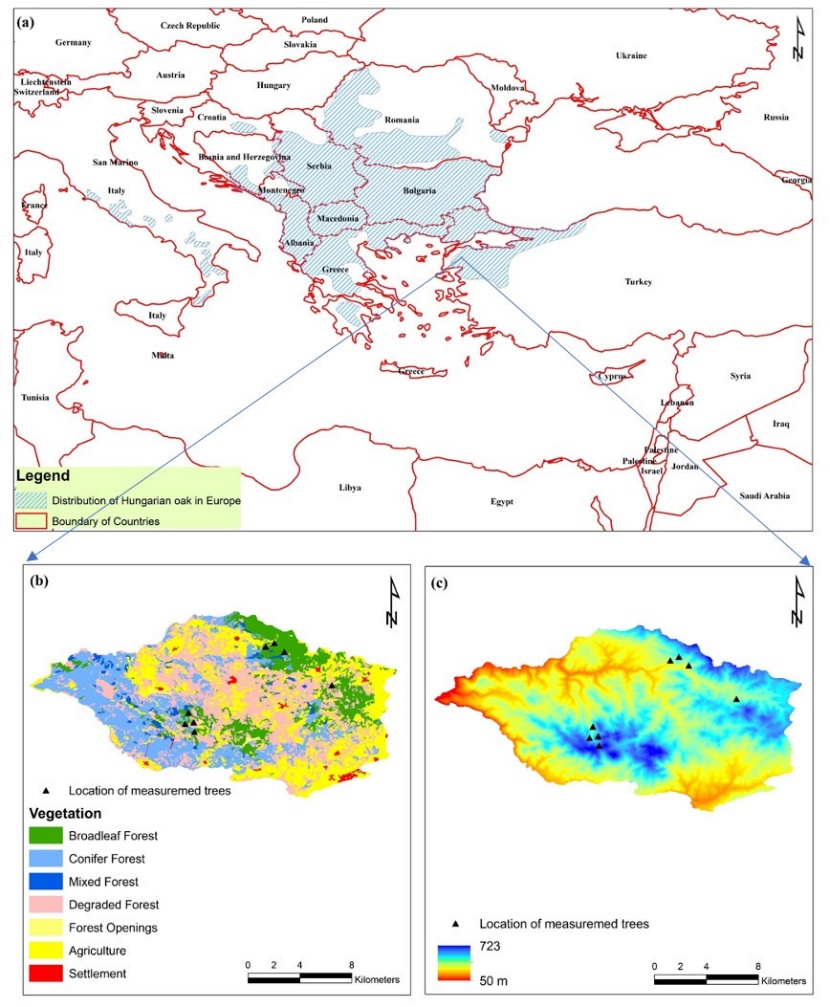
Figure 1: Distribution of Hungarian oak in Europe (a), and the conditions of study area in terms of vegetation (b) and elevation (c). / Abbildung 1: Verteilung der Ungarischen Eiche in Europa (a) und die Position der beobachteten Bäume in der Untersuchungsregion hinsichtlich Vegetationsklassen (b) und Seehöhe (c).
2.1 Study Area
This study was conducted in the Dumanlı Forest Planning Unit located within the borders of the Lapseki State Forest Enterprise, Çanakkale Regional Directorate of Forestry (26° 41’ 42’’ – 26° 56’ 40’’ E. 40° 10’ 22’’ – 40° 18’ 14’’ N., WGS84 Zone 35N) in Turkey (Figure 1). The elevation of the study area varied from between 50 and 723 m with an average slope of 22%. While the highest and the lowest temperatures observed in the study area were 39 °C and -11.2 °C, the annual average precipitation was approximately 630.7 mm. The Walter and Lieth climate diagram was prepared to show the rainfall distribution and the temperature variation in the study area (Figure 2). The total area of the study site is 19,564.4 ha, and approximately 69% of that site is covered with the forests where Brutian pine, Crimean pine and Hungarian oak are widely distributed. Hungarian oak stands occupy approximately 16% (3130.3 ha) of the total forest area.
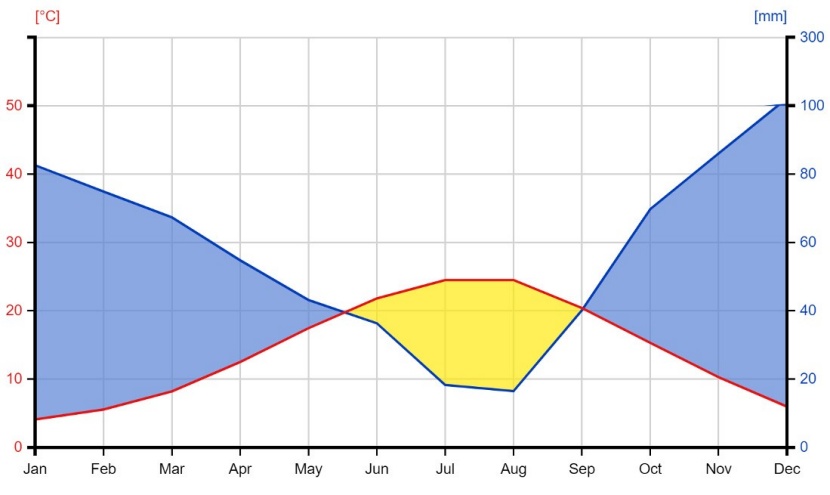
Figure 2: The distributions of temperature and rainfall in the study area (Zepner et al., 2021). The blue and red lines inside the figure show the curves of precipitation (the right axis) and temperature (the left axis) for the period of 1990-2019, respectively. The colors “yellow and “blue” between the curves suggest the months under arid and humid climate conditions, respectively. / Abbildung 2: Lufttemperatur und Niederschlag in der Untersuchungsregion (Zepner et al., 2021). Die dunkelblaue und die rote Linie zeigen die Verteilung von Niederschlag (rechte Achse) und Temperatur (linke Achse) für den Zeitraum 1990–2019. Die gelben und hellblauen Flächen zwischen den Linien zeigen Monate mit ariden und mit humiden Klimabedingungen.
2.2 Sampling and data collection methods
Diameter and height measurements were taken from a total of 470 trees in even-aged monospecific Hungarian oak stands originated from seed (Table 1). The sample trees were obtained from the stands to represent the available range of developmental ages in the studied area. Figure 2 shows a few examples for a very young forest <8 cm (a), a young forest 8-19.9 cm (b), a mature forest 20-35.9 cm (c) and an over mature forest 36-51.9 cm (d). The breast circumference of trees at a height of 1.30 m and their total heights were measured using with 1% precision using the Vertex IV ultrasound instrument. These measurements were carried out in April 2022. Some photographs from monospecific Hungarian oak stands sampled were presented in Figure 3.
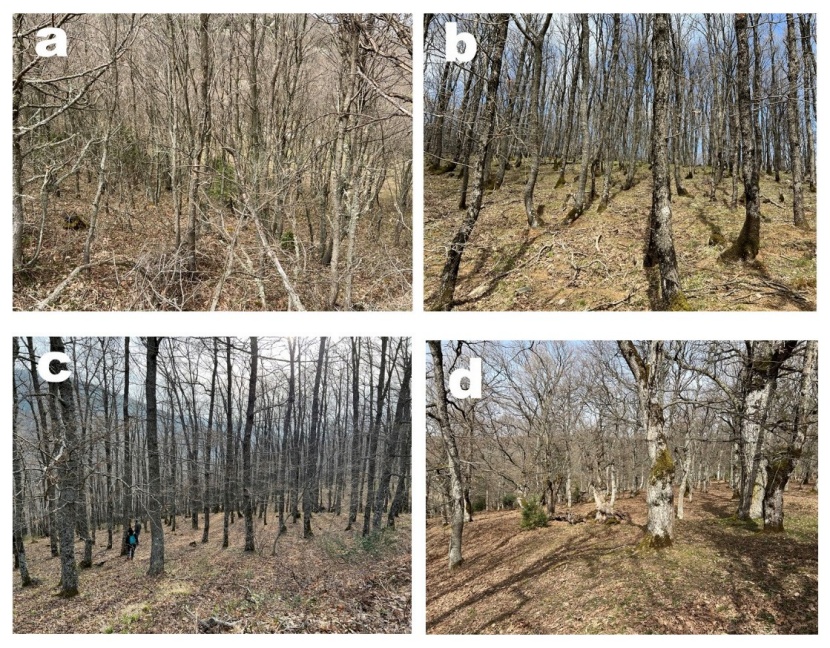
Figure 3: Photos from even-aged monospecific Hungarian oak stands; a) very young b) young c) mature d) over mature. / Abbildung 3: Aufnahmen der untersuchten gleichaltrigen Bestände, dominiert durch Ungarische Eiche; sehr jung (a), jung (b), reif (c) und überreif (d).
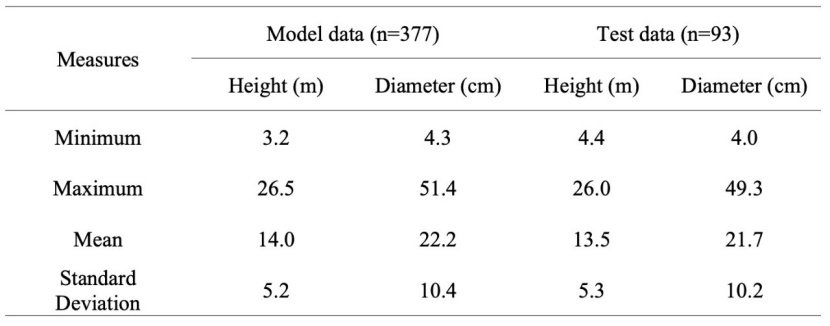
Table 1: Descriptive statistics of tree height and tree diameter measured in this study. / Tabelle 1: Beschreibende Statistiken der Baumhöhen und Stammdurchmesser, verwendet in dieser Studie.
2.3 Method
In this study, two, three and four-parameter nonlinear models were fitted for Hungarian oak stands. General expressions of them were given below. Eqs (1)-(6) models were provided from the study of Fang and Bailey (1998). Eq. (7) is a modified von Bertalanffy model (Korkmaz and Üçkardeş, 2013). During the development of models, the starting values of the regression parameters were specified using the GenSA package in R environment (R Core Team, 2022; Xiang et al., 2013). The significance of the estimated parameters was tested calculating p-values after each model was performed. It is expected that p value should be lower than 0.05, showing that the estimated parameter is statistically significant.
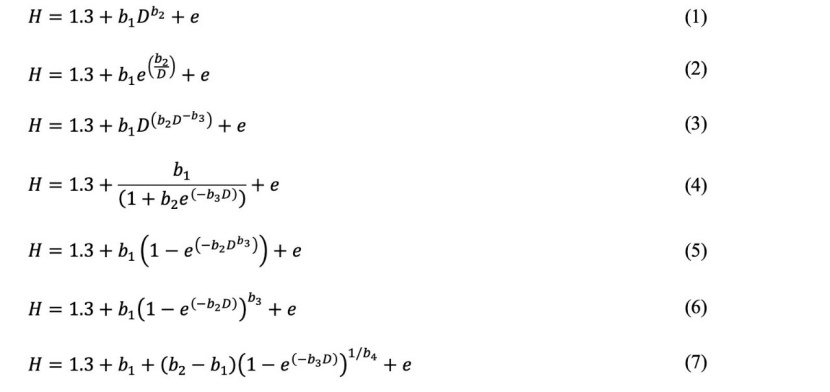
where H is individual tree height (m), D is diameter at breast height (cm), b1-4 is regression coefficient to be estimated, e is residual.
Statistical evaluation of the models considered was made using common goodness-of-fit measures showing the accuracy and the adaptability of them (Eq. (8) to (12)). A ranking method developed by Poudel and Cao (2013) was used for determining the best model.
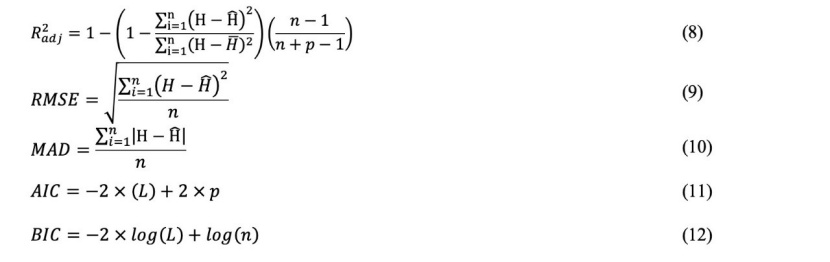
where H and Ĥ are the observed and predicted height values, respectively, H¯ is mean of the observed values, n and p are the number of observations and parameters, respectively, L is the maximized loglikelihood value for the fitted models, Radj2 is the adjusted coefficient of determination, RMSE is root mean squared error, MAD is mean absolute bias, AIC is Akaike information criterion (Akaike, 1998), and BIC is Bayesian information criterion (Schwarz, 1978).
The overall performance of the models was tested using the model data. In addition, the models were also examined using a test data. Test statistic scores were calculated based on only RMSE.
The statistical assumptions were checked by analyzing the residual distributions of the models. In a regression model, the residual distributions should be distributed normally and have a constant variance. In addition, they should be tested using Durbin-Watson statistic (DW) for the presence of possible autocorrelation (Chatterjee and Simonoff, 2013; Zuur et al., 2010). The normality test of the residuals should be made using a proper test. In this study, the Kolmogorov-Smirnov test was used.
3 Results
The estimated parameters of the nonlinear H-D models were statistically significant at 5% level. Table 2 shows their values with the standard errors.
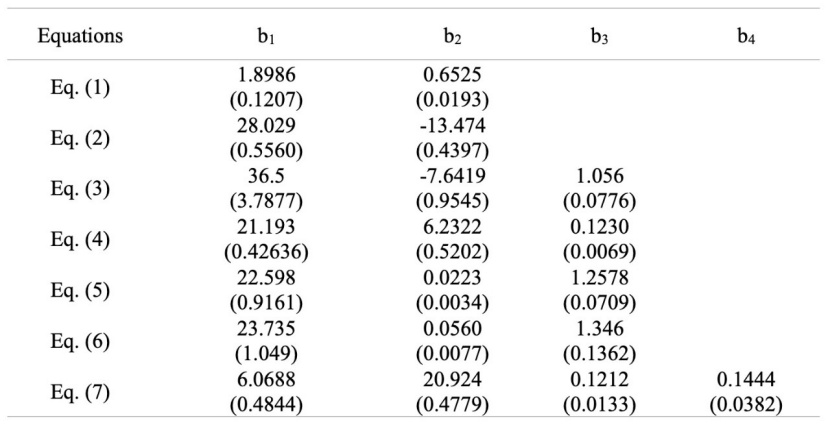
Table 2: Parameter estimates with standard error in brackets for nonlinear H-D models developed for Hungarian oak stands. The parameters and their standard errors were estimated using entire dataset. / Tabelle 2: Schätzparameter mit Standardfehler in Klammer für nichtlineare H-D-Modelle, entwickelt für ungarische Eichenbestände. Die Parameter wurden mit dem gesamten Datensatz ermittelt.
The results showed that Eq. (7) having the smallest ranking score (5.1) had the best fit. Eq. (1) having the greatest ranking score (35.0) had the worst fit (Table 3). The error statistics indicated that all models developed had an acceptable accuracy for predicting total tree heights. In addition, the relative ranking scores implied that the nonlinear H-D models developed could be divided into subgroups based on their performance. The first group, which was the most successful, was comprised of Eq. (4) and Eq. (7). Second group, which had moderate success, was consisted of Eq. (3), Eq. (5), and Eq. (6). Third group, which had the worst predictive performance, was composed of Eq. (1) and Eq. (2).
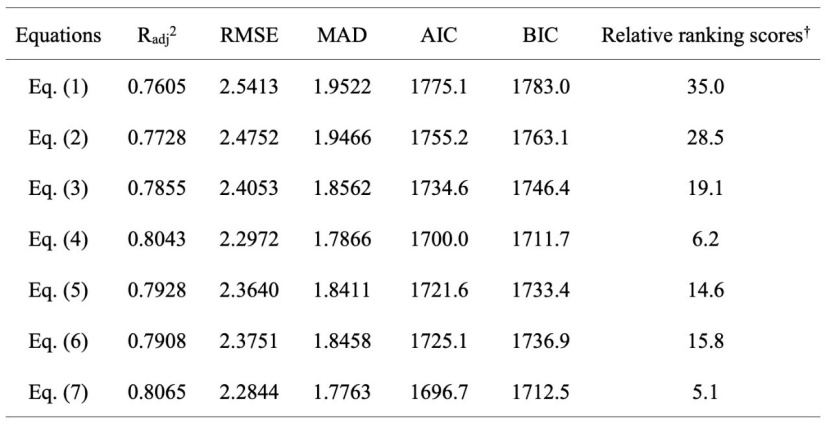
Table 3: The goodness-of-fit statistics and relative ranking scores (after Poudel and Cao 2013) of nonlinear H-D models developed for Hungarian oak stands, using model data. / Tabelle 3: Statistiken zu Anpassungsgüte und Relative Ranking Scores (nach Poudel and Cao 2013) für die getesteten nichtlinearen H-D-Modelle für ungarische Eiche unter Verwendung aller Beobachtungen.
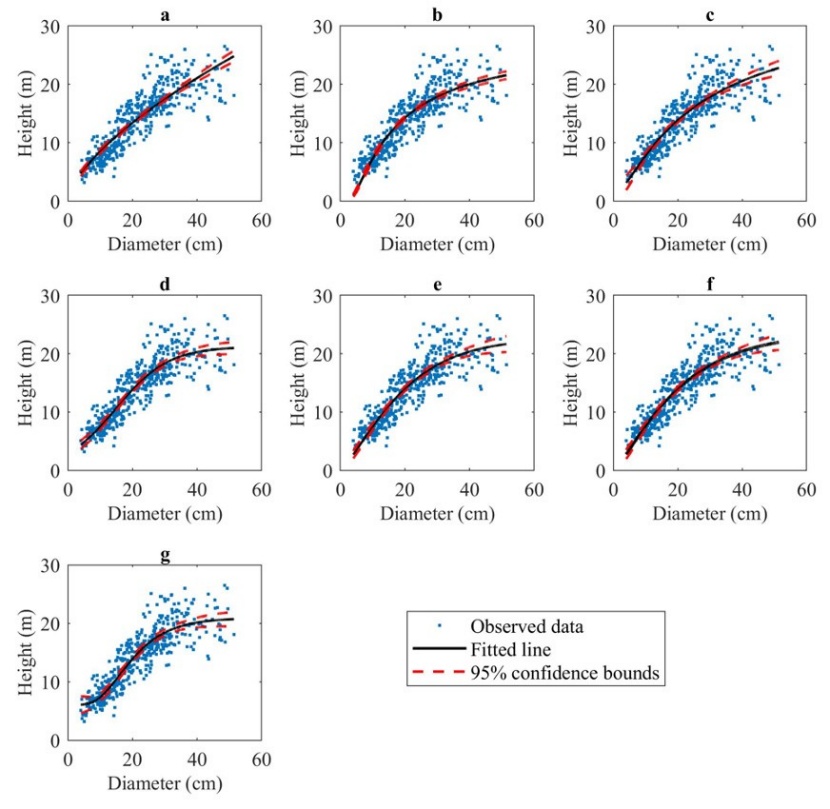
Figure 4: Plots of nonlinear H-D models with fitted lines and confidence bounds at 95% level (a, b, c, d, e, f, and g graphs represent Eq. (1), Eq. (2), Eq. (3), Eq. (4), Eq. (5), Eq. (6) and Eq. (7), respectively). / Abbildung 4: Plots der nichtlinearen H-D-Modelle mit Beobachtungen und Konfidenzintervallen auf 95%-Niveau (Panele a, b, c, d, e, f und g zeigen Gleichung (1), Gl. (2), Gl. (3), Gl. (4), Gl. (5), Gl. (6) und Gl. (7)).
The results based on test data showed that RMSE values ranged from 2.6389 to 2.7775. According to test performance of the nonlinear H-D models, Eq. (4) had the best fitness with an RMSE of 2.6389 m followed by Eq. (7) with an RMSE of 2.6447 m. The RMSE values for Eq. (1), Eq. (2), Eq. (3), Eq. (5), and Eq. (6) were 2.7070 m, 2.7775 m, 2.6664 m, 2.6765 m, and 2.6732 m, respectively.
Model behaviors against actual data were presented in Figure 4. As shown in the figure, all models behaved similarly, and they described well the patterns in observed height-diameter pairs. Goodness-of-fit statistics showed that Eq. (7) is the best with the highest Radj2 and the smallest RMSE, AIC and BIC (Fig. 5). As the number of the parameters increased, the success of the models improved. However, this improvement in models’ success was not significant enough to be considered (a 0.3 m decrease in RMSE).
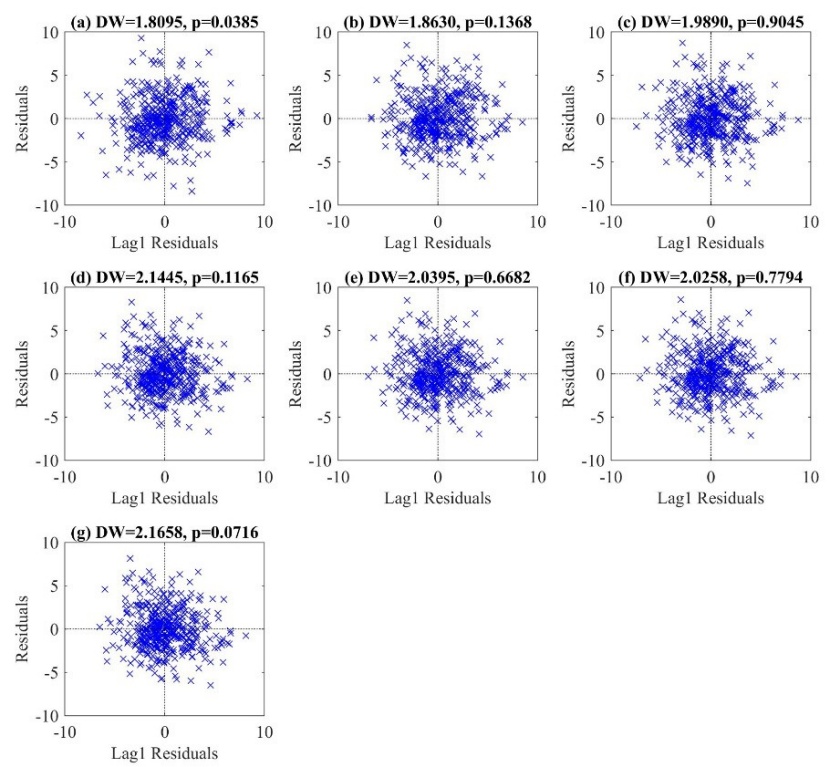
Figure 5: Plots of residual versus Lag1 residuals (a, b, c, d, e, f, and g graphs represent Eq. (1), Eq. (2), Eq. (3), Eq. (4), Eq. (5), Eq. (6) and Eq. (7), respectively). / Abbildung 5: Plots der Residuen versus Lag1 Residuen (Panele a, b, c, d, e, f und g zeigen Gleichung (1), Gl. (2), Gl. (3), Gl. (4), Gl. (5), Gl. (6) und Gl. (7)).
Fig. 5 indicated that there was no autocorrelation among the residuals of the nonlinear H-D models except for Eq. (1). Durbin-Watson statistic for Eq. (1) was 1.8095 with a p-value of 0.0385, which suggested that the residuals were correlated in the Eq. (1). In addition, Fig. 6 implied that all models except for Eq. (1) provided nearly the constant variance across the range of the data. Eq. (1) resulted in dispersed residual variance. All models except for Eq. (4) and Eq. (7) overestimated the heights of shorter trees. But that failure did not actually seem like a remarkable problem owing to the small number of the measurements for smaller trees (it accounted for approximately 4% of all data). In addition, it was observed that the residuals tended to disperse slightly following the increased fitted values. However, this dispersion was not evident enough to prove the existence of possible heteroscedasticity problem.
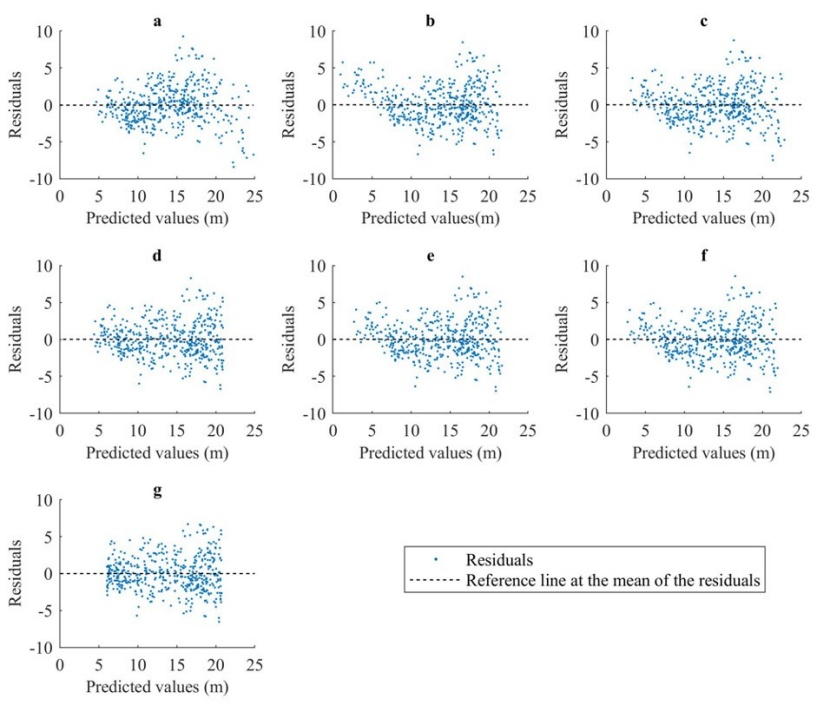
Figure 6: Scatter plots for the residuals of nonlinear H-D models versus fitted values (a, b, c, d, e, f, and g graphs represent Eq. (1), Eq. (2), Eq. (3), Eq. (4), Eq. (5), Eq. (6) and Eq. (7), respectively). / Abbildung 6: Streuplots der Residuen der nichtlinearen H-D-Modelle gegenüber den Beobachtungen (Panele a, b, c, d, e, f und g zeigen Gleichung (1), Gl. (2), Gl. (3), Gl. (4), Gl. (5), Gl. (6) und Gl. (7)).
Fig. 7 indicated that Eq. (4) and Eq. (7) showed more robust behavior across the diameter classes, especially in diameter classes including the small number of samples. Ultimately, both the goodness-of-fit statistics and the residual behaviors showed that Eq. (4) and Eq. (7) were more successful than their counterparts, and they met fully the expected statistical assumptions.
Kolmogorov-Simirnov test showed that the residual distributions of Eq. (1)-(7) were distributed normally (p>0.05). Strong similarities were observed between the cumulative distribution of the residuals and that of the standard normal distribution, which confirmed the results of the normality test (Fig. 8).
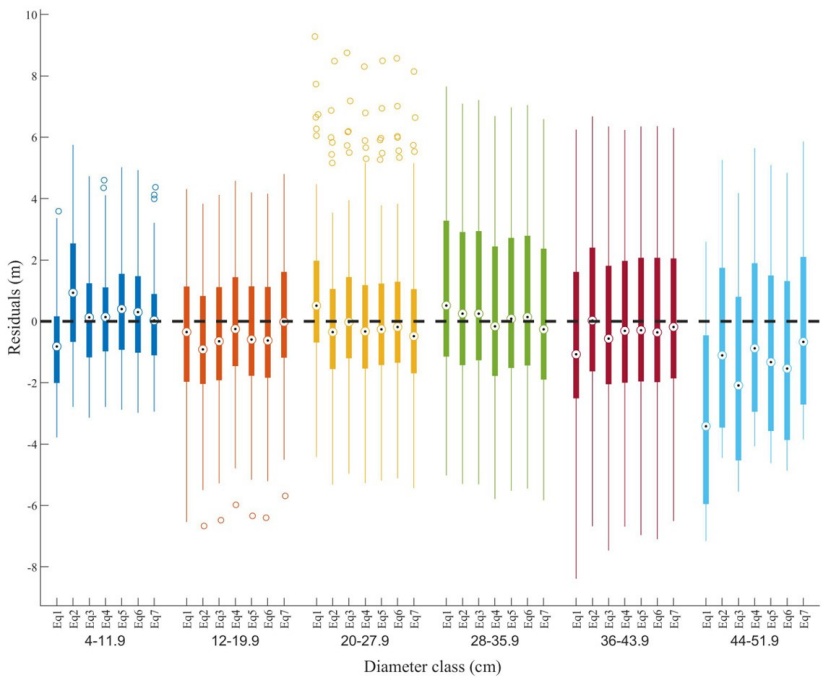
Figure 7: The residuals boxplots categorized by diameter classes for nonlinear H-D models. Eqs (1) to (7) are ordered from left to right in each class. In each boxplot, the bottom and the top of the box are 25th and 75th percentile of the residual, respectively. The central mark inside the box shows the median of the residual. The ‘o’ marker outside the box indicates the outliers. / Abbildung 7: Boxplots der Residuen gruppiert nach Durchmesserklassen für die nicht-linearen H-D Modelle. Gleichungen (1) bis (7) sind von links nach rechts geordnet in jeder Klasse. In jedem Boxplot zeigt die Box die 25% und 75% Quartile an. Der Punkt in der Mitte der Box ist der Median. Die „o“ Markierungen außerhalb der Box sind Ausreißer.
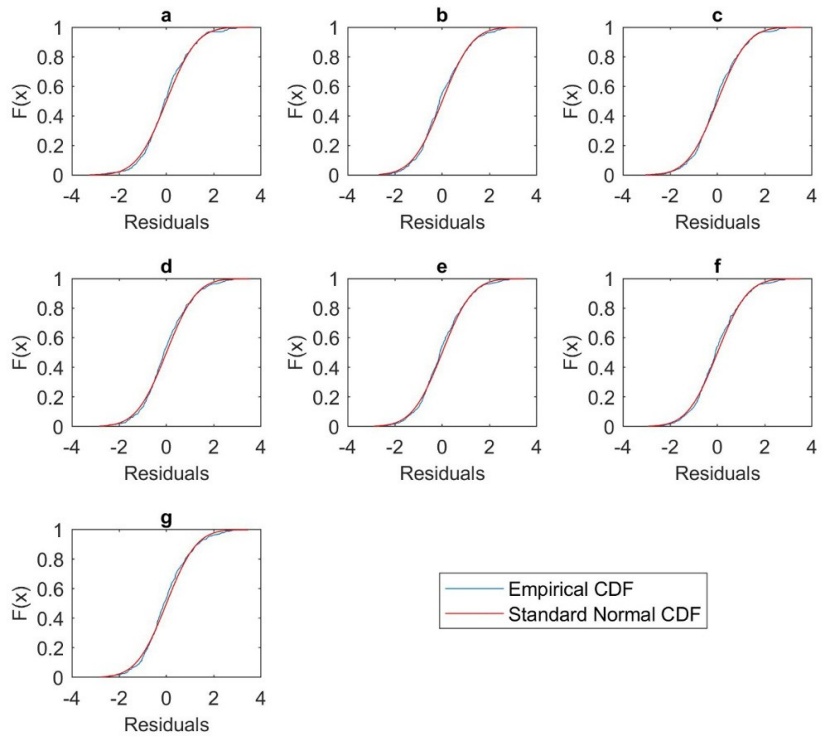
Figure 8: Line plots associated with comparing the evidenced cumulative residual distribution to the expected cumulative residual distribution (a, b, c, d, e, f, and g graphs represent Eq. (1), Eq. (2), Eq. (3), Eq. (4), Eq. (5), Eq. (6) and Eq. (7), respectively). / Abbildung 8: Linienplots zum Vergleich der tatsächlichen kumulierten Residuenverteilung mit der erwarteten kumulierten Residuenverteilung (Panele a, b, c, d, e, f und g zeigen Gleichung (1), Gl. (2), Gl. (3), Gl. (4), Gl. (5), Gl. (6) und Gl. (7)).
4 Discussion
Height-diameter models provide valuable information on economic value of a standing timber (Goulding and Murray, 1976) and timber production capacity of a stand (Newton et al., 2005) as well as stand structure (Staudhammer and LeMay, 2001; Vacek et al., 2014) and growth and yield (Montero et al., 2001; Vospernik and Eckmuellner, 2012). In addition, the H-D models are important for the remote sensing studies as well (Anwar et al., 2018; Jucker et al., 2017). While in remote sensing studies tree height can be obtained using remote sensing sensors having high spatial resolution such as IKONOS, QuickBird and Spot-5, tree diameter cannot directly be measured from them. With this regard, the inverse of the H-D models can be very useful for obtaining tree diameter (Hirata, 2008; Hirata et al., 2014, 2009; Salas et al., 2010). On the other hand, recently the remote sensing sensors having a great spatial (e.g., light detection and ranging, LiDAR) enable to extract the 3-D structure of individual trees and forests (i.e., height, crown height and crown diameter) (Kwak et al., 2007). The accuracy of these estimations can be examined using H-D models (Donev et al., 2021).
Goodness-of-fit statistics showed that the nonlinear H-D models developed were adequately fitted to the observed data. But, Eq. (1), Eq. (2), Eq. (3), Eq. (5) and Eq. (6) produced the biased predictions for both smaller and bigger trees. Therefore, the forest managers should use Eq. (4) (a type of logistic model) and Eq. (7) (a type of von Bertalanffy model). RMSE values for Eq. (4) and Eq. (7) were 2.3679 m and 2.3589 m, respectively. Lumbres et al. (2013) reported that the Logistic-type model was the best with an RMSE of 2.86510 m in predicting the heights of Khasi pine (Pinus kesiya Royle ex Gordon) species as compared with Chapman-Richards, Weibull, Schnute, Exponential and Korf/Lundqvist functions. Similar findings were reported by Abedi and Abedi (2020). In their study, the Logistic-type model gave the least prediction error with an RMSE ranged from 2.070 m to 2.162 m for the height predictions of Caucasian oak, Field maple and Hornbeam species. In contrast to these studies, in the study of Chai et al. (2018) the Chapman-Richards function was reported as the best model with an RMSE of 2.889 m in predicting the heights of Chinese cedar (Cryptomeria fortunei Hooibrenk) trees in a plantation field. Seki and Sakici (2022) recommended the use of the Chapman-Richards function having an RMSE of 1.41 m for predicting the heights of Crimean pine species. Conversely, Carus and Akguş (2018) compared a total of 20 nonlinear H-D models including the Logistic-and Richard-type models and they reported that the Chapman-Richard model gave the poorest estimations with an RMSE of 1.99 m in predicting the heights of Stone pine (Pinus pinea L.) in a planted forest.
Height-diameter relationships can considerably change depending on the stand conditions. For that reason, the additional covariates such as basal area and site index are required for generalizing a H-D model (Adame et al., 2008; Bronisz and Mehtätalo, 2020; Sharma, 2015; Sharma and Parton, 2007; Temesgen and von Gadow, K., 2004). In our study, data was collected by randomly selecting trees without sampling stand characteristics, hence the models were developed as a function of only diameter at breast height. Therefore, the estimations to be obtained from the Eq. (4) and Eq. (7) for an Oak stand outside the study area should be evaluated cautiously.
5 Conclusion
The amount of explained variations by the nonlinear H-D models ranged from 0.7605 to 0.8065. While the goodness-of-fit statistics showed that all models developed were well fitted, some of them gave an over-prediction for trees less than 5 m and taller than 20 m in height. Logistic-and modified von Bertalanffy functions resulted in better prediction accuracy. Also, these models provided the desirable biological properties such as S-shaped curve and asymptote. The results proved that the functions can be implemented in performing satisfactory accuracy for Hungarian oak stands located in Dumanlı Forest Planning Unit, Çanakkale/Turkey.
Author contributions
FB designed and performed the statistical analysis and wrote this article. AG and OÜ contributed to review and edit it. All authors read and approved its final form.
Acknowledgements
We would like to thank Associate Professor Tarkan Yorulmaz and Biologist Ayşe Kösen for their technical supports in field studies.
References
Abedi, R., Abedi, T., 2020. Some non-linear height-diameter models performance for mixed stand in forests in Northwest Iran. Journal of Mountain Science 17, 1084–1095.
Adame, P., Hynynen, J., Cañellas, I., del Río, M., 2008. Individual-tree diameter growth model for rebollo oak (Quercus pyrenaica Willd.) coppices. Forest Ecology and Management 255, 1011–1022. https://doi.org/10.1016/j.foreco.2007.10.019
Akaike, H., 1998. Information theory and an extension of the maximum likelihood principle, in: Parzen, E., Tanabe, K., Kitagawa, G. (Eds.), Selected Papers of Hirotugu Akaike, Springer Series in Statistics. Springer, New York, NY, pp. 199–213. https://doi.org/10.1007/978-1-4612-1694-0_15
Anwar, A., Saleem, U., Shaiza, B., Naveed, A., Asad, A., Khan, M.A., 2018. Quantifying forest carbon stocks by integrating satellite images and forest inventory data. Austrian Journal of Forest Science 135, 93–117.
Archontoulis, S.V., Miguez, F.E., 2015. Nonlinear regression models and applications in agricultural research. Agronomy Journal 107, 786–798. https://doi.org/10.2134/agronj2012.0506
Bronisz, K., Mehtätalo, L., 2020. Mixed-effects generalized height-diameter model for young Silver birch stands on post-agricultural lands. Forest Ecology and Management 460, 117901. https://doi.org/10.1016/j.foreco.2020.117901
Carus, S., Akguş, Y., 2018. Tarsus yöresi fıstıkçamı (Pinus pinea L.) meşcereleri için çap-boy modellerinin geliştirilmesi. Turkish Journal of Forestry 19, 1–8.
Chai, Z., Tan, W., Li, Y., Yan, L., Yuan, H., Li, Z., 2018. Generalized nonlinear height-diameter models for a Cryptomeria fortunei plantation in the Pingba region of Guizhou Province, China. Web Ecology 18, 29–35.
Chatterjee, S., Simonoff, J.S., 2013. Handbook of regression analysis. John Wiley & Sons.
Diamantopoulou, M.J., Özçelik, R., 2012. Evaluation of different modeling approaches for total tree-height estimation in Mediterranean Region of Turkey. Forest Systems 21, 383–397.
Donev, P., Wang, H., Qin, S., Meng, P., Lu, J., 2021. Estimating the forest above-ground biomass based on extracted LiDAR metrics and predicted diameter at breast height. Journal of Geodesy and Geoinformation Science 4, 13.
Ercanlı, İ., 2015. Nonlinear mixed effect models for predicting relationships between total height and diameter of Oriental beech trees in Kestel, Turkey. Revista Chapingo serie ciencias forestales y del ambiente 21, 185–202.
Fang, Z., Bailey, R.L., 1998. Height-diameter models for tropical forests on Hainan Island in southern China. Forest Ecology and Management 110, 315–327. https://doi.org/10.1016/S0378-1127(98)00297-7
Goulding, C.J., Murray, J.C., 1976. Polynomial taper equations that are compatible with tree volume equations. NZJ For. Sci 5, 313–322.
Hirata, Y., 2008. Estimation of stand attributes in Cryptomeria japonica and Chamaecyparis obtusa stands using QuickBird panchromatic data. Journal of Forest Research 13, 147–154.
Hirata, Y., Tabuchi, R., Patanaponpaiboon, P., Poungparn, S., Yoneda, R., Fujioka, Y., 2014. Estimation of aboveground biomass in mangrove forests using high-resolution satellite data. Journal of forest research 19, 34–41.
Hirata, Y., Tsubota, Y., Sakai, A., 2009. Allometric models of DBH and crown area derived from QuickBird panchromatic data in Cryptomeria japonica and Chamaecyparis obtusa stands. International Journal of Remote Sensing 30, 5071–5088.
Huang, S., Price, D., J. Titus, S., 2000. Development of ecoregion-based height-diameter models for White spruce in boreal forests. Forest Ecology and Management 129, 125–141. https://doi.org/10.1016/S0378-1127(99)00151-6
Huang, S., Titus, S.J., Wiens, D.P., 1992. Comparison of nonlinear height-diameter functions for major Alberta tree species. Can. J. For. Res. 22, 1297–1304. https://doi.org/10.1139/x92-172
Jucker, T., Caspersen, J., Chave, J., Antin, C., Barbier, N., Bongers, F., Dalponte, M., van Ewijk, K.Y., Forrester, D.I., Haeni, M., Higgins, S.I., Holdaway, R.J., Iida, Y., Lorimer, C., Marshall, P.L., Momo, S., Moncrieff, G.R., Ploton, P., Poorter, L., Rahman, K.A., Schlund, M., Sonké, B., Sterck, F.J., Trugman, A.T., Usoltsev, V.A., Vanderwel, M.C., Waldner, P., Wedeux, B.M.M., Wirth, C., Wöll, H., Woods, M., Xiang, W., Zimmermann, N.E., Coomes, D.A., 2017. Allometric equations for integrating remote sensing imagery into forest monitoring programmes. Global Change Biology 23, 177–190. https://doi.org/10.1111/gcb.13388
Karatepe, Y., Diamantopoulou, M.J., Özçelik, R., Sürücü, Z., 2022. Total tree height predictions via parametric and artificial neural network modeling approaches. iForest-Biogeosciences and Forestry 15, 95.
Korkmaz, M., Üçkardeş, F., 2013. Transformation to some growth models widely used in agriculture. J Anim Plant Sci 23, 840–844.
Koulelis, P., Daskalakou, E., Michopoulos, P., 2018. Testing non-linear height-diameter functions for three native trees of Greece on ICP forests Level II plots. Austrian Journal of Forest Science 135, 297–314.
Kwak, D.-A., Lee, W.-K., Lee, J.-H., Biging, G.S., Gong, P., 2007. Detection of individual trees and estimation of tree height using LiDAR data. Journal of Forest Research 12, 425–434.
Ledermann, T., Gschwantner, T., 2006. A comparison of selected Austrian biomass equations. Austrian Journal of Forest Science 167–183.
Lumbres, R.I.C., Jin Lee, Y., Calora Jr, F.G., Parao, M.R., 2013. Model fitting and validation of six height–DBH equations for Pinus kesiya Royle ex Gordon in Benguet Province, Philippines. Forest Science and Technology 9, 45–50.
Lynch, T.B., Holley, A.G., Stevenson, D.J., 2005. A random-parameter height-dbh model for Cherrybark oak. Southern Journal of Applied Forestry 29, 22–26.
Mısır, N., 2010. Generalized height-diameter models for Populus tremula L. stands. African Journal of Biotechnology 9, 4348–4355.
Montero, G., Cañellas, I., Ruiz-Peinado, R., 2001. Growth and yield models for Pinus halepensis Mill. Forest Systems 10, 179–201.
Newton, P.F., Lei, Y., Zhang, S.Y., 2005. Stand-level diameter distribution yield model for black spruce plantations. Forest Ecology and Management 209, 181–192.
Ng’andwe, P., Chungu, D., Yambayamba, A.M., Chilambwe, A., 2019. Modeling the height-diameter relationship of planted Pinus kesiya in Zambia. Forest Ecology and Management 447, 1–11. https://doi.org/10.1016/j.foreco.2019.05.051
Ogana, F.N., Ercanli, I., 2022. Modelling height-diameter relationships in complex tropical rain forest ecosystems using deep learning algorithm. J. For. Res. 883–898. https://doi.org/10.1007/s11676-021-01373-1
Ogana, F.N., Gorgoso-Varela, J.J., 2020. A nonlinear mixed-effects tree height prediction model: Application to Pinus pinaster Ait in Northwest Spain. Trees, Forests and People 1, 100003.
Özçelik, R., Cao, Q.V., Trincado, G., Göçer, N., 2018. Predicting tree height from tree diameter and dominant height using mixed-effects and quantile regression models for two species in Turkey. Forest ecology and management 419, 240–248.
Özçelik, R., Diamantopoulou, M.J., Crecente-Campo, F., Eler, U., 2013. Estimating Crimean juniper tree height using nonlinear regression and artificial neural network models. Forest Ecology and Management 306, 52–60. https://doi.org/10.1016/j.foreco.2013.06.009
Özçelik, R., Yavuz, H., Karatepe, Y., Gürlevik, N., Kırış, R., 2014. Development of ecoregion-based height-diameter models for 3 economically important tree species of southern Turkey. Turkish Journal of Agriculture and Forestry 38, 399–412.
Özdemir, G.A., Saraçoğlu, Ö., 2016. Trakya meşe ormanlarında artım ve büyüme ilişkileri. Forestist 66, 211–243.
Paulo, J.A., Tomé, J., Tomé, M., 2011. Nonlinear fixed and random generalized height–diameter models for Portuguese cork oak stands. Annals of Forest Science 68, 295–309.
Poudel, K.P., Cao, Q.V., 2013. Evaluation of methods to predict Weibull parameters for characterizing diameter distributions. Forest Science 59, 243–252.
R Core Team, 2022. R: A language and environment for statistical computing. R Foundation for Statistical Computing, Vienna, Austria. URL https://www.R-project.org/.
Raptis, D.I., Kazana, V., Kazaklis, A., Stamatiou, C., 2021. Mixed-effects height–diameter models for black pine (Pinus nigra Arn.) forest management. Trees 35, 1167–1183.
Salas, C., Ene, L., Gregoire, T.G., Næsset, E., Gobakken, T., 2010. Modelling tree diameter from airborne laser scanning derived variables: A comparison of spatial statistical models. Remote Sensing of Environment 114, 1277–1285.
Schwarz, G., 1978. Estimating the dimension of a model. The Annals of Statistics 6, 461–464.
Seki, M., Sakıcı, O.E., 2022. Ecoregion-based height-diameter models for Crimean pine. Journal of Forest Research 27, 36–44. https://doi.org/10.1080/13416979.2021.1972511
Sharma, M., 2015. Comparing Height-Diameter relationships of boreal tree species grown in plantations and natural stands. Forest Science 62, 70–77. https://doi.org/10.5849/forsci.14-232
Sharma, M., Parton, J., 2007. Height–diameter equations for boreal tree species in Ontario using a mixed-effects modeling approach. Forest Ecology and Management 249, 187–198. https://doi.org/10.1016/j.foreco.2007.05.006
Skudnik, M., Jevšenak, J., 2022. Artificial neural networks as an alternative method to nonlinear mixed-effects models for tree height predictions. Forest Ecology and Management 507, 120017.
Sönmez, T., 2009. Generalized height-diameter models for Picea orientalis L. Journal of Environmental Biology 30, 767.
Staudhammer, C.L., LeMay, V.M., 2001. Introduction and evaluation of possible indices of stand structural diversity. Canadian journal of forest research 31, 1105–1115.
Subedi, T., Bhandari, S.K., Pandey, N., Timilsina, Y.P., Mahatara, D., 2021. Form factor and volume equations for individual trees of Shorea robusta in Western low land of Nepal Formfaktor-und Volumengleichungen für den Salbaum (Shorea robusta) im westlichen Tiefland von Nepal. Austrian Journal of Forest Science 143–166.
Temesgen, H., Hann, D.W., Monleon, V.J., 2007. Regional height-diameter equations for major tree species of southwest Oregon. Western Journal of Applied Forestry 22, 213–219.
Temesgen, H., von Gadow, K., 2004. Generalized height-diameter models – an application for major tree species in complex stands of interior British Columbia. European Journal of Forest Research 123, 45–51.
Thurnher, C., Gerritzen, T., Maroschek, M., Lexer, M.J., Hasenauer, H., 2013. Analysing different carbon estimation methods for Austrian forests. Austrian Journal of Forest Science 141–165.
URL-1, 2020. General Directory of Forestry-Forestry Statistics in Turkey. Republic of TÜRKİYE Ministry of Agriculture and Forestry, General Directorate of Forestry. URL https://www.ogm.gov.tr/tr/e-kutuphane/resmi-istatistikler (accessed 8.24.22).
Vacek, S., Vacek, Z., Podrazsky, V., Bilek, L., Bulusek, D., Stefancik, I., Remes, J., Sticha, V., Ambroz, R., 2014. Structural diversity of Autochthonous beech forests in Broumovské steny National Nature Reserve, Czech Republic. Austrian Journal of Forest Science 131, 191–214.
Vanderschaaf, C.L., 2020. Predictive ability of mixed-effects height–diameter models fit using one species but calibrated for another species. Forest Science 66, 14–24.
Vospernik, S., Eckmuellner, O., 2012. Evaluation of the individual tree growth model Prognaus. Aust. J. For. Res 129, 22–55.
Wu, H., Xu, H., Tang, F., Ou, G., Liao, Z., 2022. Impacts of stand origin, species composition, and stand density on height-diameter relationships of dominant trees in Sichuan Province, China. Austrian Journal of Forest Science 139, 51–72.
Xiang, Y., Gubian, S., Suomela, B., Hoeng, J., 2013. Generalized Simulated Annealing for Global Optimization: The GenSA Package. The R Journal 5, 13. https://doi.org/10.32614/RJ-2013-002
Yang, S.-I., Burkhart, H.E., 2020. Evaluation of total tree height subsampling strategies for estimating volume in Loblolly pine plantations. Forest Ecology and Management 461, 117878.
Yuancai, L., Parresol, B.R., 2001. Remarks on Height-Diameter.
Zengin, H., Yeşil, A., Asan, Ü., Bettinger, P., Cieszewski, C., Siry, J.P., 2013. Evolution of modern forest management planning in the Republic of Turkey. Journal of Forestry 111, 239–248.
Zepner, L., Karrasch, P., Wiemann, F., Bernard, L., 2021. ClimateCharts.net – an interactive climate analysis web platform. International Journal of Digital Earth 14, 338–356. https://doi.org/10.1080/17538947.2020.1829112
Zuur, A.F., Ieno, E.N., Elphick, C.S., 2010. A protocol for data exploration to avoid common statistical problems. Methods in Ecology and Evolution 1, 3–14.


