Schlüsselbegriffe: Landsat-Bild, digitales Höhenmodell, Topografie, Klima, Standort, Picea orientalis, Pinus sylvestris, Fagus orientalis, Alnus glutinosa
Abstract
In this study, the effects of altitudinal topographic variables on the spatial distribution of tree species distributed at timberline and treeline ecotones were investigated in the Zigana mountains of the Eastern Black Sea Region. The lower and upper limits of the timberline and the treeline ecotones were defined as mean elevation ± standard deviation (1876 ± 424 m, >1000 m). At the upper limit of the treeline ecotone, limiting the growth period to the summer months (higher average temperatures and fewer precipitations) increased the drought considerably. The average altitude of Fagus orientalis-Alnus glutinosa was 94 ± 2.9 m higher in the northern aspect and Pinus sylvestris was 53 ± 6.1 m higher in the southern aspect. For Picea orientalis, altitudes of aspects were quite close to each other. Statistical analysis showed that altitude increases have stricter ecological demands that increase the spatial polarization of tree species. Correlation analysis showed that F. orientalis-A. glutinosa, which prefers humid, shady, and low sun-exposed sites, increased this need even more with the increase in altitude. While P. sylvestris and P. orientalis increased their spatial distributions in hot-dry and sun-exposed sites with an increase in altitude, this trend was stronger in P. sylvestris. Although F. orientalis-A. glutinosa and P. sylvestris, which increased spatial polarization, further limited their sites, P. orientalis was more tolerant than these species. It is expected that this study will make important contributions regarding how the tree species in the region can adapt to possible climate change.
Zusammenfassung
In dieser Studie wurden die Auswirkungen höhentopografischer Variablen auf die räumliche Verteilung von Baumarten, die in der Baumgrenze und den Ökotonen der Baumgrenze verbreitet sind, in den Zigana-Bergen der östlichen Schwarzmeerregion untersucht. Die unteren und oberen Grenzen der Baumgrenze und der Ökotone der Baumgrenze wurden als mittlere Höhe ± Standardabweichung (1876 ± 424 m) definiert. An der Obergrenze des Ökotons der Baumgrenze führte die Begrenzung der Wachstumsperiode auf die Sommermonate (höhere Durchschnittstemperaturen und weniger Niederschläge) zu einer erheblichen Zunahme der Trockenheit. Die durchschnittliche Höhe des Buchen-Erlen-Waldes (Fagus orientalis und Alnus glutinosa) war 94 ± 2.9 m höher in der Nordseite und die Wälder der Waldkiefer (Pinus sylvestris) waren 53 ± 6.1 m höher in der Südseite. Bei den Orientfichten-Wäldern (Picea orientalis) lagen die Höhenlagen ziemlich nahe beieinander. Statistische Analysen zeigten, dass Höhenzunahmen strengere ökologische Anforderungen haben, die räumliche Polarisierung von Baumarten verstärken. Korrelationsanalysen zeigten, dass Buche und Erle feuchte, schattige und sonnenarme Standorte bevorzugen und dass sich dieser Bedarf mit zunehmender Höhenlage noch verstärkt. Während Waldkiefer und Fichte ihre räumliche Verbreitung in heißtrockenen und sonnenexponierten Lagen mit zunehmender Höhenlage verstärkten, war dieser Trend bei Waldkiefer stärker ausgeprägt. Während Buche-Erle und Waldkiefer in der räumlichen Ausbreitung eingeschränkt sind, war Fichte toleranter gegenüber Standortbedingungen. Diese Studie liefert einen Beitrag, welchen Einfluss Klimawandel auf die Baumarten in dieser Region haben könnte.
1 Introduction
In mountainous regions, timberline and treeline are natural borders, where tree species struggle to adapt to extreme environmental conditions. These borders, which are important for both landscape and site conditions (Burga et al. 2004), are the transition zone between a closed forest in a high mountainous area, a bush, and a meadow in an alpine area (Körner & Paulsen 2004, Körner 2021). It is not a simple forest border, but it is a transition zone between less or more well-defined two borders (Holtmeier 2009). The upper limit of natural forests with a steep slope and increased stand fragmentation and stuntedness is sometimes referred to as the treeline ecotone (Körner 1998) or more commonly as here the treeline ecotone. The treeline above the timberline defines the border between the subalpine and alpine vegetation regions as well as the trees that hold on to the highest peaks (Körner 2003, Körner 2021). In this region, it is possible to see sparse trees and tree islands between forest and alpine vegetation. The climate in this area is characterized by very windy, long cold winters, and short summers with rainy and cool weather (Dan et al. 2014).
The position of the tree border does not change randomly around a contour line, but other topographic variables can predictably determine this location (Bader and Ruijten 2008). Temperature, sun exposure, and humidity, which affect subalpine and alpine vegetation distributions, are strongly correlated with topography (Peet 1981, He et al. 2019). The altitude limit of the treeline is determined by a lack of heat during the growing season, extreme minimum temperatures in winter, reduced growing period lengths, or a combination of these effects (Becwar et al. 1981).
Topography is an almost constant-unchangeable factor among many factors affecting the forest/tree borders and thus the tree species distribution. Most of the other factors such as solar radiation, near-surface wind flow, temperatures, soil moisture, the length and depth of the snow cover, and their effects, the distribution of soil types, and site conditions, in general, are changed and controlled by the geomorphic structure (Broll et al. 2007, Butler et al. 2007). The effects of topography on-site conditions, such as the distribution of soil moisture, may differ under different climates. For example, while the lack of moisture in the convex topography can be tolerated in a humid climate, in a dry climate it can result in a more severe drought (Holtmeier & Broll 2005, Holtmeier & Broll 2018).
Similar micro-topography (local) effects on solar radiation, wind, and snow cover may also vary according to spatial (Holtmeier 2005, 2009). Thus, land features derived from digital elevation models (DEM) can be used as environmental variables such as local temperature and humidity. Various studies have been conducted for modeling mountain vegetation as a function of environmental indicators derived from DEM (Salinger & Mullan 1999, Efthymiadis et al. 2007, Toivonen et al. 2018). Using topographic variables derived from DEM instead of environmental variables measured in the field is common practice in modeling mountain vegetation (Abdollahnejad et al. 2017, Chiang & Valdez, 2019).
In most regions of the northern hemisphere, the treeline is formed by conifers (e.g. Picea, Abies, Pinus, Larix, Juniperus) and locally, by deciduous species (e.g., Betula, Fagus, Populus, Rhododendron) (Holtmeier & Broll 2010). The aim of this study was to explore the effects of altitudinal topographic variables on the distribution of tree species (P. sylvestris, P. orientalis, and F. orientalis-A. glutinosa) in the timberline/treeline ecotones. This study has the following objectives:
i) determination of timberline/treeline position,
ii) classification of land cover types (P. sylvestris, P. orientalis, and F. orientalis-A. glutinosa, and open space) on Landsat 8 OLI satellite image,
iii) relationships between climate, tree species distributions and timberline/treeline position and
iv) effects of altitude on tree species distributions.
2 Material and Methods
2.1 Study Area
The research area is located between 39°20' – 39°47' eastern longitudes and 40°51' – 40°33' northern latitudes in Northeastern Turkey (Figure 1). The study was carried out in an area of 763.82 km2.

Figure 1: Location and Landsat classified image of study area. / Abbildung 1: Lage und Landsat-klassifiziertes Bild des Untersuchungsgebiets.
In the area where the temperate climate of the Black Sea prevails, the altitude reaches up to 3071 m in the Zigana Mountains. In the research area, in the forest zone that continues up to 1700 m altitude, deciduous and coniferous taxa generally composed of Euro-Siberian elements are dominant. The Picetum zone, resistant to moist, semi-humid winter conditions, is dominant in the area from 900 – 1000 m altitudes up to the upper limit of the forest zone. The main tree species of this zone is Picea orientalis and it rarely forms a mixture with species such as Pinus sylvestris, Fagus orientalis, rarely Abies nordmanniana subsp. nordmanniana, Ostrya carpinifolia, Taxus baccata, Ulmus glabra. Species such as Ribes biebersteinii, Viburnum orientale, Lonicera caucasica, Rhododendron ponticum, and Rhododendron luteum are found in mid- and understories (Uzun 2002). In the alpine zone, tree species such as Betula litwinowii, Betula pendula, Populus tremula, and Acer trautvetteri are also distributed (Palabaş 2002).
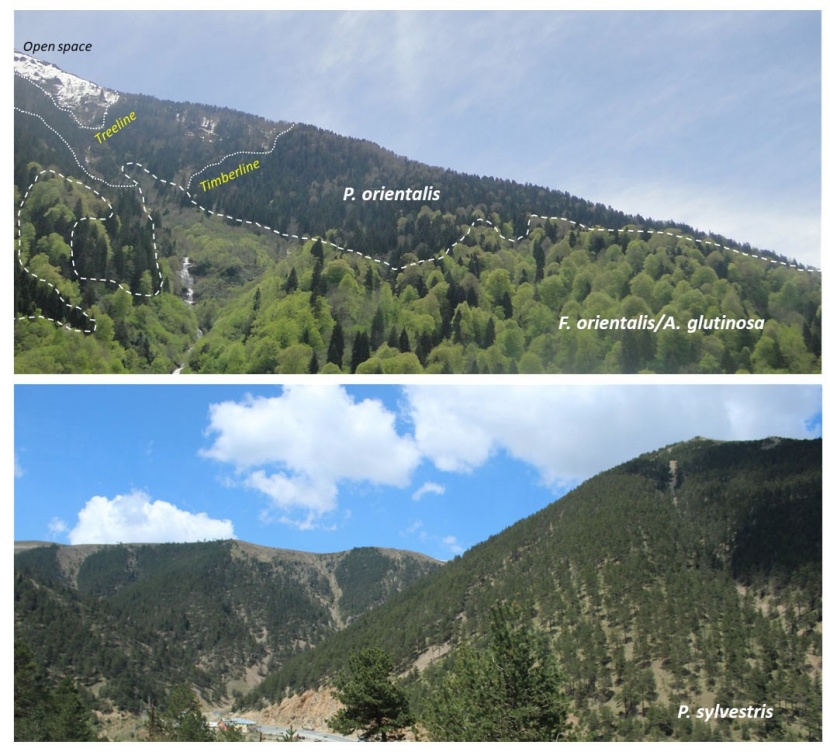
Figure 2: Photographs from the study area. / Abbildung 2: Aufnahmen aus dem Untersuchungsbereich.
2.2 Data Acquisition and Processing
The Landsat 8 Operational Land Imager (OLI) image and a DEM generated from Advanced Spaceborne Thermal Emission and Reflection Radiometer (ASTER) Global Digital Elevation Model Version 2 (GDEM Ver2) were used in this study. The Landsat 8 OLI image and DEM had a resolution of 30 m. Both the Landsat 8 OLI image and the DEM were geo-referenced by the supplier (USGS 2000, GLCF 2006). The scene of Landsat 8 OLI was obtained from USGS (http://earthexplorer.usgs.gov). Earth Explorer imagery archive for the 2019 year. The image was acquired on July 30, 2019. The cloudiness rate was low (0.52%). The topographic variables and classification of the Landsat 8 OLI image were obtained using ArcGIS (ESRI 2013).
2.3 Classification and Validation
Landsat 8 OLI satellite image was used as remote sensing data and the forest cover type map (GDF 2008) was used as ground data in determining the land cover types in this study. Four land cover types such as deciduous, P. orientalis, P. sylvestris, and open space were generated from the forest cover type map. In this study, the supervised classification algorithm (Maximum likelihood classification) was used for classification. Maximum likelihood classification (MLC) is the most widely used supervised classification and is used in a variety of applications (Sisodia et al. 2014). In this classification stage, each unknown pixel on the image is assigned to the class with which it is most similar. Two methods were followed during the comparison of accuracy values in supervised classification. The first of these is the principle of assigning an equal number of control points to each control class, and the second is the principle of randomly assigning control points to the control class in cases where there is not enough space for the classes. In this study, the principle of the equal number of checkpoints was applied since there was enough space for each land cover type. Ground reference data (land cover types) was gathered as signatures using Erdas Imagine (2014) for Landsat 8 OLI satellite image. A total of 100 ground (25 signatures for each land cover type) reference points were determined as signatures for the classification of the Landsat 8 OLI image. The signatures were taken from homogeneous pixels. Thus, four different land cover types were classified on the Landsat 8 OLI satellite image. The raster map obtained as a result of the supervised classification was subjected to accuracy analysis with the help of the forest cover type map that was previously created by ground measurement studies. Total 205 control points using Erdas Imagine software for land cover types (F. orientalis-A. glutinosa, P. orientalis, P. sylvestris, and open space) were used to determine the accuracy of the classification method (Figure 3, Table 1). The pixels on which the points fall on the classified data were selected and the compatibility of these pixels with the reference data was examined (Musaoğlu 1999). As a result of the comparison of the selected pixels with the reference data, the classification accuracy of the classified pixels was obtained from the classification error matrix (Sunar and Musaoğlu 1998). As a result of the supervised classification applied, the percentage of total accuracy of the classification and the kappa values that enable these accuracies to be evaluated statistically were calculated. The overall accuracy of classification was 77.6% and the kappa statistics was 0.67 (Table 1). In the mixed deciduous stands the dominant species F. orientalis, which together with A. glutinosa represent 87.9% of the stand. Dominant species were determined by using the forest cover type map. In mixed stand types, the dominant species has the first place in the stand type code. For example, KnKzc2 is a stand type in the forest cover type map. Here, Kn: Fagus orientalis, Kz: Alnus glutinosa, c: development stages, and 2: crown closure (41-100%). The dominant species for this stand type would be F. orientalis.
Forest management plans in Turkey are prepared for periods of 10 or 20 years. The most important stage in the preparation of forest management plans is the inventory studies carried out in the field. In the preparation of management plans, a draft forest cover type is created by using remote sensing data (aerial photography, satellite images, etc.) before going to the field. At the inventory stage, sample areas are established with an interval of 300 x 300 meters and classical inventory measurements are made in each sample area. Necessary data for each sample area is obtained. Then, by combining ground measurements and remote sensing data, the forest cover types map is produced with the geographic information systems. The produced forest cover type map is used as base data in all studies related to the forestry discipline in Turkey. In this study, the forest cover types map was used as ground data in the supervised classification stage for determining the land cover types on the Landsat 8 OLI satellite image.

Table 1: Confusion matrix of the supervised classification of Landsat image. / Tabelle 1: Konfusionsmatrix der überwachten Klassifizierung von Landsat-Bildern.

Figure 3: Locations of control points for classification of Landsat image. / Abbildung 3: Standorte von Kontrollpunkten für Klassifizierung von Landsat-Bildern.
2.4 Topographic Variables and Data Preparation
The DEM was used to derive the following topographic variables and environmental indices: altitude, slope, aspect (topographic solar-radiation index, eastern exposure, and northern exposure), topographic position index, and site exposure index (SEI) (Figure 4, Table 2). The circular aspect is transformed to a value of one for southwesterly azimuths, and a value of zero for north- northeast azimuths, obtaining a continuous variable between 0 – 1 (Roberts and Cooper 1989). Topographic solar radiation index (Trasp) is calculated by:

COS (North Exposure) and SIN (East Exposure) transformations of aspect metrics assume the northeast azimuth of 45° is a maximum and the southwest quadrant can be an empirically reproduced minimum. The set of variables stated by Stage (1976) involved slope percentage (s), slope percentage times cosine of aspect (slope x cosine (aspect°)), slope percentage times sine of aspect (slope x sine (aspect°)). TPI is the difference between the altitude of each grid cell in a digital terrain model and the averaged altitude of a neighborhood defined by circles of arbitrary radius. According to Weiss (2001), TPI is calculated for a single grid cell by:

where “h” is the altitude of a grid cell in meters above sea level, “xh” is the mean altitude of grid cells in the neighborhood with radius r. The circular aspect is determined to a north/south axis and is weighted by the steepness of the slope on a value from -100 to 100 (Balice et al., 2000). SEI is calculated by:

where “cosine” is in radians and degrees east of north.

Table 2: Topographic variables and their ecological meanings. / Tabelle 2: Topographische Variablen und deren ökologische Bedeutungen.
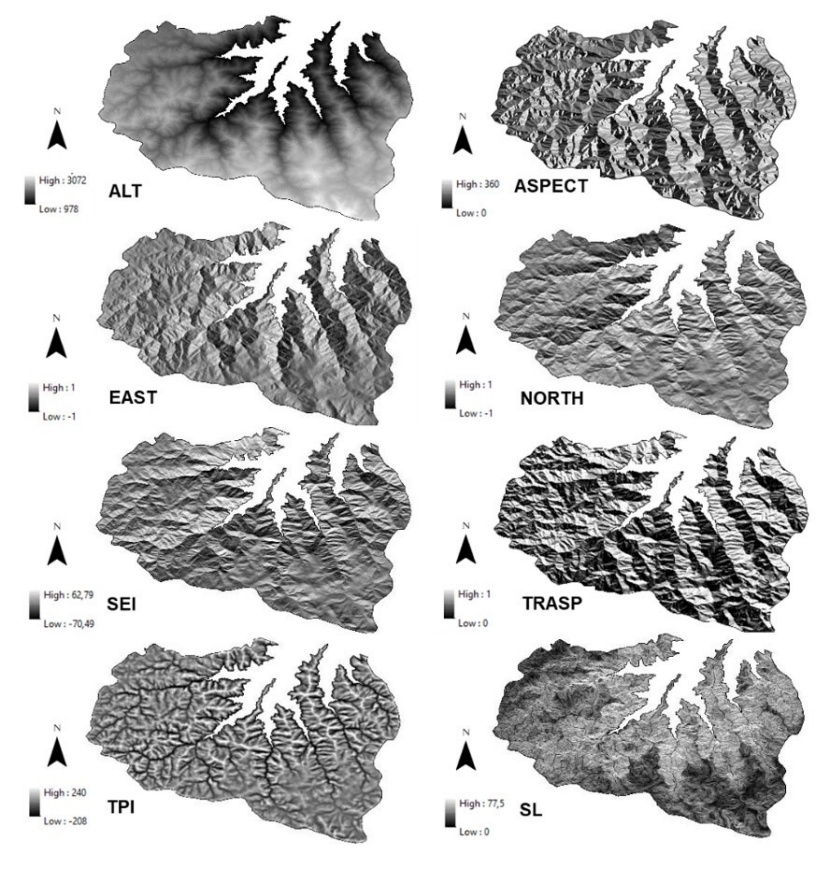
Figure 4: Topographic variables. / Abbildung 4: Topografische Variablen.
The position of the treeline was derived from the Landsat 8 OLI image and used to determine a timberline/treeline ecotone. This ecotone was used to remove altitudes outside the area of the timberline/treeline. The timberline/treeline ecotones were defined as the mean treeline altitude ± standard deviation (Bader & Ruijten 2008). In the study, a total of 55,133 points were determined systematically (59 x 77 m) in forest areas (>1000 m). P. orientalis is represented by 27,894 points, P. sylvestris 3,047 points, and the mixed deciduous forest (F. orientalis-A. glutinosa) 24,192 points.
2.5 Thornthwaite Climate Analysis
In the study, Thornthwaite climate analysis was applied to the altitudes of the timberline and the treeline ecotones. Thornthwaite method is based on the relationship between temperature and precipitation and evapotranspiration. According to the method, the water balance of an area is prepared by using the monthly average temperature, monthly average precipitation, and monthly evapotranspiration values of that area. Evapotranspiration is calculated using the following formula (Thornthwaite 1948).

PE : Monthly potential evapotranspiration (cm)
t : Monthly average temperature (°C)
I : Annual temperature index (total of 12 months)
G : Latitude correction coefficient
Kantarcı's formula (2005) was used to derive drought index and climate type during the vegetation period.

I : The monthly value of the drought index,
GET : Monthly actual evapotranspiration (mm)
Tom : Average monthly maximum temperature (°C)
2.6 Statistical Analysis
In the research area, the comparison of forest trees for timberline and treeline ecotones according to topographic variables was performed by variance (ANOVA) analysis. Relationships between topographic variables and species distributions were carried out with Pearson correlation analysis. Estimation of the altitudinal distributions of tree species with topographic variables was determined by multiple linear regression analysis. SPSS program was used for statistical analysis.
3 Results
3.1 Determination of Timberline/Treeline Ecotones
The maximum altitude in the research area reaches up to 3071 m. In the study, altitudes below 1000 m were excluded. The average altitude and standard deviation were calculated from the remaining borders (1000 m). The lower and upper altitude limit of timberline/treeline ecotones was defined as the mean altitude ± standard deviation (1876 ± 424 m). In this way, the lower average altitude (-std. deviation) was determined as ‘timberline ecotone’ and the upper (+std. deviation) as ‘treeline ecotone’ (Figure 5).

Figure 5: Altitude and aspect of the timberline/treeline ecotones. / Abbildung 5: Höhenlage und Aspekt der Ökotone der Waldgrenze/Baumgrenze.
3.2 Thornthwaite Climate Analysis
For timberline and treeline ecotones, Thornthwaite (1948) climate analysis was applied to the data of the Maçka-Meryemana (1100 m) meteorological station and Torul-Zigana (2050 m) automatic observation station in the Değirmendere watershed (Table 3). The climate type was determined according to Kantarcı (2005). The climate type of the research area was semi-drought for timberline ecotone and semi-arid/arid for treeline ecotone.
With the increase in altitude, the annual total precipitation decreased considerably. Declining precipitation and shortening vegetation period to summer months when average temperatures are high increased drought. In treeline ecotone, the number of dry days in the vegetation period increased up to 30 days in August (Table 3). At the same time, the difference between the maximum and minimum temperatures in August was quite high (about 20-21 °C). The limiting of the growth period to the summer months with decreasing rainfall and high average temperatures also increased the drought. In treeline ecotone, the number of dry days in the growth period increased up to 30 days in August (Table 3). At the same time, the difference between the maximum and minimum temperatures in August was quite high (about 20-21 °C).

Table 3: Thornthwaite climate analysis results. / Tabelle 3: Ergebnisse der Klimaanalyse nach Thornthwaite.
3.3 Land Covers and Environmental Variables
Timberline/treeline area was divided into two ecotones. The areas of the land cover (F. orientalis-A. glutinosa, P. orientalis, P. sylvestris, and open space) according to these ecotones are given in Table 4. The total forest area in both ecotones was 152.4 km2. The forest area in treeline ecotone was lower (10.34%) compared to timberline ecotone (61.67%). The highest decrease in treeline ecotone was observed in F. orientalis-A. glutinosa and P. orientalis distributions. In contrast, P. sylvestris distribution showed less decline (Table 4).

Table 4: Area of forest types in timberline and treeline ecotones. / Tabelle 4: Waldfläche nach Bestandestypen in den Waldgrenze und Baumgrenze Ökotonen.
The distribution of forest trees under different topographic conditions (altitude and altitude-aspect combination) was determined to detect whether timberline/treeline ecotones are related to topography (Table 5, Figure 5). For the timberline and the treeline ecotones, the average altitudes of the tree species (F. orientalis-A. glutinosa, P. orientalis, and P. sylvestris) according to aspect are given in Table 5. The average altitude of F. orientalis-A. glutinosa was 94±2.9 m higher in the north aspect compared to the south aspect. While P. sylvestris increased its altitude in the south aspect by 53±6.1 m compared to the north aspect, the average altitudes of P. orientalis in the north and south aspect were quite close (Table 5).

Table 5: Average altitudes of tree species according to aspect. / Tabelle 5: Durchschnittliche Höhenlagen der Baumarten nach Aspekten.
The distribution of forest trees to aspect groups was different depending on the altitude (Figure 6). P. orientalis showed a homogeneous distribution in the north and south aspects, whereas F. orientalis-A. glutinosa and P. sylvestris showed an opposite distribution. While the distribution of F. orientalis-A. glutinosa increased in the north aspect, P. sylvestris increased in the south aspect (Figure 6).

Figure 6: Frequency distribution of tree species along an altitude gradient (a) and their average altitude versus aspect (b). / Abbildung 6: Verteilung der Baumarten entlang eines Seehöhengradienten (a) und deren durcschnittliche Seehöhe im Vergleich zum Aspekt (b).
3.4 Altitudinal Topographic Controls in The Distribution of Tree Species
To determine how timberline/treeline ecotones are controlled through topographic variables, the relationships between forest tree distributions and topographic variables were statistically determined. Variance analysis results showed significant differences between forest trees according to topographic variables. Tree species were statistically different (p <0.001) for all topographic variables (SL, TRASP, NORTH, EAST, TPI, and SEI) in I. and II. altitude zones (Table 6).
Generally, tree species showed similar ecological features in timberline and treeline ecotones. F. orientalis-A. glutinosa showed the distribution in more shady, moist, and less sun-exposed sites according to TRASP, NORTH, EAST, and SEI. P. sylvestris showed the distribution in warmer, arid, and sun-exposed sites. Compared to F. orientalis-A. glutinosa, P. orientalis, and P. sylvestris preferred ridge and hilly (TPI) sites. When timberline and treeline ecotones are compared, the topographic differences between tree species distributions were more pronounced depending on the altitude (Table 6).

Table 6: Variance analysis results. / Tabelle 6: Ergebnisse der Varianzanalyse.
In timberline ecotone, according to the variables of TRASP, NORTH, and SEI, except for EAST, F. orientalis-A. glutinosa preferred areas with higher shade and humidity and less sun exposure. Interestingly, it was observed that F. orientalis-A. glutinosa shifted the slopes exposed to the west (EAST). In treeline ecotone, the distribution of P. orientalis and P. sylvestris increased in areas with warmer-drought and sun exposure. The increase in P. sylvestris was higher compared to P. orientalis. F. orientalis-A. glutinosa preferred more sheltered valleys (TPI) compared to P. orientalis and P. sylvestris (Table 6). Pearson correlation analysis was performed for the relationship between altitude and topographic variables affecting the distribution of tree species (F. orientalis-A. glutinosa, P. orientalis, and P. sylvestris) in timberline/treeline ecotones (1452-2300 m) (Figure 6).
Correlation analysis results showed significant relationships between altitude and topographic variables for tree species. In F. orientalis-A. glutinosa, there was a positive relationship between altitude and SL, NORTH, and a negative relationship between altitude and TRASP, EAST, TPI, and SEI. For P. orientalis, it was found a positive relationship between altitude and TRASP, TPI, SEI, and a negative relationship between altitude and SL and NORTH. For P. sylvestris, it was found a positive relationship between altitude and TRASP, TPI, and SEI, and a negative relationship between altitude and EAST and NORTH (Figure 6). P. orientalis and P. sylvestris showed similar correlations in many topographic variables (TRASP, NORTH, TPI, and SEI). The correlation coefficients (except for TPI) obtained from P. sylvestris were higher. These topographic variables showed negative correlations for P. orientalis and P. sylvestris and positive correlations for F. orientalis-A. glutinosa (Figure 7).

Figure 7: Correlations between altitude and topographic variables for species. / Abbildung 7: Korrelationen zwischen Höhenlage und topographischen Variablen für Baumarten.
Estimation of altitude variable for tree species with other topographic variables was determined by regression analysis (Figure 7, Table 7). EAST and SEI for F. orientalis-A. glutinosa, SL, and TPI for P. orientalis and NORTH, TPI, and SEI variables for P. sylvestris entered the prediction equation (Table 7).

Table 7: Multiple linear stepwise regression models to predict altitude. / Tabelle 7: Stufenweise lineare Regressionsmodelle um Höhenlage vorherzusagen.

Figure 8: Prediction of altitude for forest covers and partial plots (1: F. orientalis-A. glutinosa, 2: P. orientalis, 3: P. sylvestris). / Abbildung 8: Abschätzung der Höhenlage mittels Waldbedeckungen und Teilparzellen (1: F. orientalis-A. glutinosa, 2: P. orientalis, 3: P. sylvestris).
4 Discussion
4.1 Factors Limiting Tree Species Distributions and Timberline/Treeline Position
At the local scale, the timberline/treeline ecotones are of varying thicknesses from abrupt borders with varying spatial shapes to vegetation additions due to tree density (Bader et al. 2007). These ecotones represent the critical limits related to tree growth by low temperatures at high altitude tree borders (Körner 2012, Körner 2021). To determine these critical limits, the study area was divided into two ecotones: timberline (1452-1876 m) and treeline (1877-2300 m). Landsat 8 OLI satellite image was used to separate timberline/treeline ecotones and tree species (F. orientalis-A. glutinosa, P. orientalis, P. sylvestris, and open space). The overall accuracy of classification was 77.6% and the kappa statistics was 0.67. These results were acceptable values for classification. In the study area, annual average temperatures varied between 7.7 – 5.5 °C in the timberline ecotone and between 5.5 – 3.4 °C in treeline ecotone (Table 3). Minimum temperatures decreased to -3.7 °C at the upper limit of the timberline and -5.8 °C at the upper limit of the treeline. Climate is a complete factor affecting the altitude of the treeline and timberline. In the continental climate ecosystems, the higher temperature in the growing season allows for the upward distribution of timberline (Peili et al. 2020). According to average temperatures (10 °C), the growth period decreased to 4 months at the upper limit of the timberline and 3 months at the upper limit of the treeline. The maximum altitudes of tree species in treeline ecotone were 2122 m for P. orientalis, 2238 m for F. orientalis-A. glutinosa, and 2253 m for P. sylvestris (Table 5). The decrease in average temperatures at these altitudes close to the upper limit of the treeline may increase the sensitivity of trees to dehydration and photoinhibition, depending on the species.
From physiological studies, near tolerance limits to environmental variables such as low temperatures, seedlings are more vulnerable than plants settled to the reductions in carbon gain associated with chronic photoinhibition. Photoinhibition caused by cold may play a role in limiting the regeneration and hence the distribution of species in forest boundaries (Ball et al. 1991, Döweler et al. 2021). From physiological studies, seedlings located near tolerance limits to environmental variables such as low temperatures are more vulnerable than resident plants to the reductions in carbon gain associated with chronic photoinhibition (Ball et al. 1991). Current temperature in timberline/treeline ecotones is often assumed to be the main limitation for growth (Körner 2021), but other factors such as local moisture availability, solar radiation, wind, snow cover, geomorphic processes, and human influence can also determine forest distribution (Holtmeier & Broll 2005). According to the Thornthwaite climate analysis, a semi-arid climate prevailed in the timberline ecotone, and a semi-arid-arid climate in the treeline ecotone. Moreover, the increase in altitude reduced the total annual precipitation. During the growth period, total annual precipitation at the upper limit of the treeline (2300 m) decreased to 55.9 mm. The limiting of the growth period to the summer months (higher average temperatures and lower precipitations) increased the drought considerably. In treeline ecotone, August (30 days) month was completely dry during the growing period (Table 3). Photoinhibition can be encouraged by high or low temperatures that occur in conjunction with high light (Robakowski et al. 2021). Compared to treeline ecotone, timberline ecotone is a closed and settled forest structure. The closed forest can prevent seedlings from drying and damaging through wind, high radiation (Holtmeier 2009), and photoinhibition. The shade-seedling relationship leads to less photoinhibition (Germino and Smith 1999), important increases in photosynthetic carbon gain during the summer growing period, development of root growth, improved drought stress, and increased seedling survival (Smith et al. 2003). In the study, drought during the growing period (August) in treeline ecotone is an indication that the seedlings may be vulnerable to drying and death. In this case, tree species are likely to shift to sites where they can be exposed to wind, high radiation, and less photoinhibition to the extent their ecological tolerance allows for survival.
There was a strong spatial polarization of tree species depending on altitude in the transition from timberline ecotone to treeline ecotone. P. orientalis showed a homogeneous distribution in northern and southern aspects, whereas F. orientalis-A. glutinosa and P. sylvestris showed an opposite distribution in different aspects. Preferably, P. sylvestris is distributed in the hottest, driest, and earlier snowless sites. At these altitudes, P. orientalis preferred more middle positions, while F. orientalis-A. glutinosa was dominant in more snow cover and moist soils due to the north aspect. A similar situation was reported by Kullman (2010). This difference may arise from the unique ecological characteristics and requirements of tree species that occur in the timberline/treeline ecotone, as well as site conditions. Kullman (2010) stated that this differentiation also gives a clue about the success of these species from the perspective of past and future climate changes.
In the study, an increase in altitude increased the distribution of F. orientalis-A. glutinosa in the northern aspect. The average altitude of F. orientalis-A. glutinosa was 94 m higher in the northern aspect (average 1694 m) compared to the southern aspect (average 1600 m) (Figure). Bonanomi et al. (2018) determined that the altitude of the Fagus sylvatica treeline is at a lower altitude (average 115 m) in the southern aspect compared to the colder northern aspect of the mountains studied here. In fact, other environmental limitations interact with low temperature to suppress treeline on south slopes. It has been argued that the presence of precipitation and soil moisture may limit tree growth in the treeline, particularly on hot slopes (Weiss et al. 2015). Bonanomi et al. (2018) reported weak negative correlations between treeline altitudes and the warmest season of the year, and explosive warming or indirectly summer drought could be a problem for Fagus sylvatica. The treeline position does not fluctuate randomly around an altitudinal contour line but depends on other topographic variables in a predictable way (Bader & Ruijten 2008). In many studies, it has been emphasized that in addition to climate (Körner & Paulsen 2004), treeline altitude at the local and regional scale is strongly influenced by topography, landforms, and geomorphological processes that occur at high altitudes (Holtmeier & Broll 2012, Malanson et al. 2011). In cases where the treeline is limited by geomorphological restrictions, these factors may be more important than the climate in determining treeline altitude as they directly control tree formation and growth (Leonelli et al. 2011, Macias-Fauria & Johnson 2013).
4.2 Altitudinal Topographic Controls in Tree Species Distributions
Variance analysis results showed that tree species were statistically different (p<0.001) in the timberline and treeline ecotones according to all environmental variables (SL, TRASP, NORTH, EAST, TPI, and SEI) (Table 5). In general, differences between species were similar in timberline and treeline ecotones. The altitude increase, in other words, in the transition from timberline to treeline, tree species had stricter ecological demands to increase spatial polarization. In both ecotones, F. orientalis-A. glutinosa preferred more humid (TRASP), shady (NORTH and EAST), and low insolation (SEI) sites. In the transition from timberline to treeline, the averages of topographic variables in F. orientalis-A. glutinosa changed from 0.29 to 0.24 in TRASP, from 0.34 to 0.52 in NORTH, from -0.02 to -0.16 in EAST, and from -17.07 to -25.68 in SEI. This change showed that, except for EAST, F. orientalis-A. glutinosa shifted to much more shady, moist, and far less sun-exposed sites. The presence of a positive relationship between altitude and NORTH and a negative relationship between altitude and TRASP, EAST, TPI, and SEI in the correlation analysis performed for both ecotones also supported these results. F. orientalis desires a warm-cool climate zone with balanced precipitation distribution, high relative humidity, and low-temperature extremes (Atalay 1983, Anşin & Özkan 1997). A. glutinosa is adapted to a wide temperature range and is relatively frost tolerant. It requires a high-water availability combined with atmospheric humidity for growth and development (Durrant et al. 2016). Statistical analysis showed that F. orientalis-A. glutinosa increased the tendency to shift to the west (EAST) depending on altitude in treeline ecotone. These species can cope with low temperatures in settled sites (timberline) where crown closure is good. However, in open areas (treeline) where there is no crown closure, the survival of these species becomes difficult. These species can tolerate or prevent freezing for short periods, but long-term freezing is critical for growth. However, seedlings are more susceptible to dehydration and photoinhibition caused by strong radiation (EAST), especially in the morning, when photosynthesis is not fully functional after cold nights (Ball et al. 1991, Germino & Smith 1999). In F. orientalis-A. glutinosa, exposure to the west aspect may affect its distribution due to the growing period drought-sunshine duration. In the study area, the fog layer that shows up in the afternoon covers the upper altitudes (1500-2000 m) of the basin (Karadeniz 1999). Due to fog, sun exposure is prevented to some extent. F. orientalis-A. glutinosa, which increase their distribution in shady and humid areas, preferred more sheltered middle and lower slopes than P. orientalis and P. sylvestris species, which prefer higher slopes and hilly areas. While TPI value of F. orientalis-A. glutinosa was -3.47 in timberline ecotone, it declined to -6.45 in treeline ecotone. A negative correlation was found between F. orientalis-A. glutinosa distribution and TPI in the correlation analysis based on altitude. Also, a significant positive relationship was found between altitude and SL. The relationship between altitude and TPI and SL showed that, depending on the altitude, F. orientalis-A. glutinosa species preferred more sheltered and humid sites. This is expected for F. orientalis-A. glutinosa species. It was previously stated that the limiting of the growth period to the summer months (higher average temperatures and lower precipitations) increased the drought considerably. The presence of precipitation and soil moisture may limit tree growth and thus species distribution at the treeline, especially on warm slopes (south aspect) (Weiss et al. 2015). The number of dry days in the growth period, which decreased to 3 months at the upper limit of treeline ecotone, was 41 days in total. F. orientalis-A. glutinosa are expected to shift to lower slopes that are more moist, shady, and have higher soil water availability (deeper soil). In fact, that EAST and SEI variables are included in the equation in the estimation of altitude by regression analysis is important. In the mountain and arctic tree borders of the Northern Hemisphere, coniferous trees grow near the border of their ecological range. They have adapted to low temperatures, short growing seasons, and harsh conditions during the winter months (Seo et al. 2010). Furthermore, roots of the treeline-associated conifers can penetrate rocky undergrounds, allowing for the utilization of water sources in deep and wet soil layers (Valentini et al. 1994). Although P. sylvestris increased its average elevation in the southern aspects, P.orientalis did not show an apparent aspect trend. P. sylvestris was on average 53 m higher in the southern aspect compared to the northern aspect (Figure). The average altitudes of P. orientalis in the northern aspect and southern aspect were very close to each other. Across its wide distribution range, P. sylvestris grows naturally in a variety of sites, and as a pioneer species, it is well adapted to nutrient-poor soils and can readily regenerate after major natural or human disturbances (Gardner 2013, Mátyás et al. 2004). It usually grows in sunny and partially shaded, generally nutrient-poor (Farjon 2010) areas. In both ecotones, P. sylvestris and P. orientalis increased their distribution in warmer and drier (TRASP, NORTH, and EAST), sun-exposed (SEI) sites.
The averages of topographic variables in P. sylvestris changed from 0.46 to 0.65 in TRASP, from 0.00 to -0.22 in NORTH, from 0.11 to 0.05 in EAST, and from -0.11 to 11.29 in SEI. However, the averages in P. orientalis changed from 0.42 to 0.47 in TRASP, from 0.15 to 0.08 in NORTH, from 0.00 to -0.02 in EAST, and from -7.09 to -3.93 in SEI. This change showed that both species shifted to much warmer and drier sites. Moreover, it was another consequence that P. sylvestris was able to adapt to more arid and sun-exposed sites. The reason for this can be the drought during the growing period in the treeline ecotone. From these results, it can be understood that P. sylvestris is better than P. orientalis at tolerating summer drought. In correlation analysis, the presence of a positive correlation between altitudes of P. sylvestris and P. orientalis and TRASP and SEI and a negative relationship between NORTH supported this situation. Although these two species showed similar correlations, the correlation coefficients obtained in P. sylvestris were higher. However, the presence of a negative relationship between the altitude increase in P. sylvestris and EAST was another evidence of this. Members of the Pinus genus were found to be highly tolerant of seasonal drought (Rundel & Yoder 1998, Sarris & Mazza 2021). Pine is the most competitive and invasive, shade-intolerant species in relatively dry, exposed, and snow-poor subalpine sites. During the early Holocene, Pine occurred at the highest treeline towards the alpine tundra in most places. The treeline peaked with the Little Ice Age decreased to its lowest post-glacial level after thousands of years of oscillatory climate cooling, and it was reported to have reached at least 500 m higher about a century ago (Kullman 2010). This is conclusively demonstrated by the remains of radiocarbon-dated fossil trees preserved in peat and lake sediments (Kullman & Kjällgren 2006). In the area where the study area is located, there are P. sylvestris stand remains (Trabzon-Akçaabat and Trabzon-Sürmene-Çamburnu beaches), which descended to the coast after the glacial age and still survive.
It has been reported that it is rarely encountered in the relatively arid parts of the mountains facing inward, although P. orientalis prefers high humidity in high mountain climates and with abundant precipitation in summers (Saatçioğlu 1969). P. orientalis generally prefers sites that have adequate and stable snow cover, mobile soil water, and are tolerant to early summer drought (Schmidt-Vogt 1977). Rarely, it is prominently found in dry places with thin and wavy snow cover. It is subject to severe and prolonged seasonal soil freezing or frequent freeze-thaw cycles. Picea individuals often survive these difficult periods and recover when more favorable conditions return (Kullman 2007). P. sylvestris and P. orientalis, which prefer hot and drier areas, increased their distribution in the upper slope and hilly areas in the transition from timberline to treeline. P. orientalis's TPI value increased from 3.57 in timberline ecotone to 34.80 in treeline ecotone. P. sylvestris's TPI value increased from -2.70 in timberline ecotone to 16.89 in treeline ecotone. The presence of a positive relationship between the distribution of P. orientalis and P. sylvestris and TPI in the correlation analysis based on altitude also supported this. The fact that these species increase their distribution on the upper slopes and hilly areas, which may reduce the moisture availability in the soil, despite the summer drought, indicated that they are more resistant to strong winds. With regression analysis, altitude was estimated by SL and TPI in P. orientalis and NORTH, TPI, and SEI in P. sylvestris (Table 7). This estimate showed that when transitioning from timberline to treeline ecotone, P. sylvestris preferred hot-arid, middle, and upper slopes, whereas P. orientalis preferred lower slope (ridge flats) sites in hilly areas. In addition, it is ecologically important to enter the sun exposure (SEI) variable into the estimation equation in the regression analysis due to F. orientalis-A. glutinosa and P. sylvestris species showing an opposite correlation. Local topography's exposure to incoming solar radiation, snowless season length, humidity conditions, temperature, and the strongest contrasts in vegetation can be expected in high mountainous regions (Holtmeier & Broll 2017). Solar radiation increases further vegetation stress with summer drought (Sabaté et al. 2002, Wang et al. 2019).
5 Conclusion
The effects of altitudinal topographic variables on the distribution of tree species (P. sylvestris, P. orientalis, and F. orientalis-A. glutinosa) in the Zigana mountains were investigated in this study. The lower and upper altitude limits of timberline/treeline ecotones were defined as mean elevation ± standard deviation (1876 ± 424 m). At the upper limit of the treeline ecotone, the limiting of the growth period to the summer months (higher average temperatures and lower precipitations) increased the drought considerably. The altitude increases have stricter ecological demands that increase the spatial polarization of tree species. F. orientalis-A. glutinosa further increased the need for humid, shady, and low sun-exposed sites with the increase in altitude. While P. sylvestris and P. orientalis distribution increased in hot-dry and sun-exposed sites with an increase in altitude, this trend was much higher for P. sylvestris. Although F. orientalis-A .glutinosa and P. sylvestris, which increased spatial polarization, further limited their sites, P. orientalis was more tolerant than these species. This study is expected to present important contributions to how tree species in the region where the effects of climate change will be observed can adapt to this change. Also, this study provides important ideas for future works in the Zigana mountains.
References
Abdollahnejad A, Panagiotidis D, Shataee Joybari S & Surový P. 2017. Prediction of dominant forest tree species using quickbird and environmental data. Forests, 8(2), 42.
Anşin R & Özkan Z C. 1997. Seed Plants (Spermatophyta) Woody Taxa. Karadeniz Technical University Faculty of forestry, 512 p (In Turkish).
Atalay İ. 1983. A general survey of the vegetation of north-eastern Anatolia. Ege Coğrafya Dergisi, 1(1), İzmir.
Bader M Y & Ruijten J J. 2008. A topography‐based model of forest cover at the alpine tree line in the tropical Andes. Journal of Biogeography, 35(4), 711-723.
Bader M Y. Rietkerk M & Bregt A K. 2007. Vegetation structure and temperature regimes of tropical alpine treelines. Arctic, Antarctic, and Alpine Research, 39, 353–364.
Ball M C, Hodges V S & Laughlin G P. 1991. Cold-induced photoinhibition limits regeneration of snow gum at tree-line. Functional Ecology, 663-668.
Balice R G, Miller J D, Oswald B P, Edminister C, Yool S R. 2000. Forest surveys and wildfire assessment in the Los Alamos region, 1998–1999. Los Alamos Nat. Lab., LA-13714-MS.
Becwar M R, Rajashekar C, Bristow K J H & Burke M J. 1981. Deep undercooling of tissue water and winter hardiness limitations in timberline flora. Plant Physiology, 68(1), 111-114.
Bonanomi G, Rita A, Allevato E, Cesarano G, Saulino L, Di Pasquale G, Saracino A. 2018. Anthropogenic and environmental factors affect the tree line position of Fagus sylvatica along the Apennines (Italy). J. Biogeogr. 45 (11), 2595–2608. https://doi.org/10.1111/jbi.13408
Broll G, Holtmeier F K, Anschlag K, Brauckmann H J, Wald S A & Drees B. 2007. Landscape mosaic in the treeline ecotone on Mt. Rodjanoaivi, subarctic Finland. Fennia 185: 89-105.
Burga C A, Klötzli F & Miehe G. 2004. Waldgrenze: Phänomen und globaler Vergleich. In: Burga, C. A., Klötzli, F. & G. Grabherr (eds.) Gebirge der Erde. Landschaft, Klima, Pflanzenwelt. Ulmer, Stuttgart, 20-21.
Butler D R, Malanson G P & Fagre D B. 2007. Influences of geomorphology and geology on alpine treeline in the American West – More important than climatic influences? Phys. Geogr. 28: 434-450.
Chiang S H & Valdez M. 2019. Tree species classification by integrating satellite imagery and topographic variables using maximum entropy method in a Mongolian forest. Forests, 10(11), 961.
Deng Y, Chen X, Chuvieco E, Warner T & Wilson J P. 2007. Multi-scale linkages between topographic attributes and vegetation indices in a mountainous landscape. Remote Sensing of Environment, 111(1), 122-134.
Döweler F, Case B S, Buckley H L & Bader M K. 2021. High light-induced photoinhibition is not limiting seedling establishment at abrupt treeline ecotones in New Zealand. Tree Physiology, 41(11), 2034-2045.
Durrant T H, De Rigo D, Caudullo G. 2016. Alnus glutinosa in Europe: distribution, habitat, usage and threats. European Atlas of Forest Tree Species, 64-65.
Efthymiadis D, Jones P D, Briffa K R, Böhm R & Maugeri M. 2007. Influence of large‐scale atmospheric circulation on climate variability in the Greater Alpine Region of Europe. Journal of Geophysical Research: Atmospheres, 112(D12).
ERDAS. 2014. ERDAS Imagine 2014. Hexagon Geospatial, Peachtree Corners Circle Norcross.
ESRI. 2013. ArcGIS Desktop: Release 10.2. Redmond, CA: Esri Inc.
Farjon A. 2010. A handbook of the world's conifers, Vol. 2. – Leiden, Boston: Brill.
Gardner M. 2013. Pinus sylvestris. The IUCN Red List of Threatened Species. Retrieved October 24, 2018, from https://doi.org/10.2305/IUCN.UK.2013-1.RLTS.T42418A2978732.en
GDF. 2008. Trabzon Regional Directorate of Forestry, Maçka Forest Management Directorate Management Plans, Trabzon.
Germino M J & Smith W K. 1999. Sky exposure, crown architecture, and low‐temperature photoinhibition in conifer seedlings at alpine treeline. Plant, Cell & Environment, 22(4), 407-415.
GLCF. 2006. Global Land Cover Facility. Earth Science Data Interface. http://glcf.umiacs.umd.edu/index.shtml
Guo D, Zhang H Y, Hou G L, Zhao J J, Liu D Y & Guo X Y. 2014. Topographic controls on alpine treeline patterns on Changbai Mountain, China. Journal of Mountain Science, 11(2), 429-441.
He J, Zhao W, Li A, Wen F & Yu D. 2019. The impact of the terrain effect on land surface temperature variation based on Landsat-8 observations in mountainous areas. International Journal of Remote Sensing, 40(5-6), 1808-1827.
Holtmeier F K & Broll G. 2005. Sensitivity and response of northern hemisphere altitudinal and polar treelines to environmental change at landscape and local scales. Global Ecol. Biogeogr. 14: 395-410.
Holtmeier F K & Broll G. 2010. Altitudinal and polar treelines in the northern hemisphere causes and response to climate change (Obere und polare Baumgrenze auf der nördlichen Hemisphäre Ursachen und Antwort auf den Klimawandel). Polarforschung, 79(3), 139-153.
Holtmeier F K & Broll G. 2012. Landform influences on treeline patchiness and dynamics in a changing climate. Physical Geography, 33(5), 403-437.
Holtmeier F K & Broll G. 2017. Treelines – Approaches at different scales. Sustainability, 9(5), 808.
Holtmeier F K, & Broll G E. 2018. Soils at the altitudinal and northern treeline: European Alps, Northern Europe, Rocky Mountains-a review. Insights of Forest Research, 2(1), 67-83.
Holtmeier F K. 2005. Relocation of snow and its effects in the treeline ecotone with special regard to the Rocky Mountains, the Alps and Northern Europe. Die Erde 136: 343-373.
Holtmeier F K. 2009. Mountain timberlines. Ecology, patchiness and dynamics (2nd ed.). Advances in Global Change Res. 36, Springer Sciene + Media B. V. 1-437.
Holtmeier F. 2009. Mountain timberlines: Ecology, patchiness, dynamics. In Advances in Global Change Research; Springer Science & Business Media: Berlin, Germany, Volume 36, pp. 5–10.
Kantarcı M D. 2005. Forest ecosystems knowledge, İstanbul University, Faculty of Forestry, Publication No.: 488, İstanbul.
Karadeniz Y. 1999. Fogy days in Trabzon and around. Balıkesir University. The Journal of Social Sciences Institute. 2(3), 16-23.
Korner, C (1998). Are-assessment of high elevation treeline positions and their explanation. Oecologia, 115, 445-459
Körner C & Paulsen J. 2004. A world‐wide study of high altitude treeline temperatures. Journal of biogeography, 31(5), 713-732.
Körner C. 2003. Alpine Plant Life: Functional Plant Ecology of High Mountain Ecosystems 2nd edition Springer-Verlag Berlin Heidelberg. New York, 47-128.
Körner C. 2012. Alpine Treelines: Functional Ecology of the Global High Elevation Tree Limits; Springer: Basel, Switzerland, p. 220.
Körner, C. 2021. The cold range limit of trees. Trends in Ecology & Evolution, 36(11), 979-989.
Kullman L & Kjällgren L. 2006. Holocene pine tree‐line evolution in the Swedish Scandes: Recent tree‐line rise and climate change in a long‐term perspective. Boreas, 35(1), 159-168.
Kullman L. 2007. Modern climate change and shifting ecological states of the subalpine/alpine landscape in the Swedish Scandes. GeoÖko 28, 187-221.
Kullman L. 2010. One century of treeline change and stability – experiences from the Swedish Scandes. Landscape Online, 17(1-31).
Leonelli G, Pelfini M, di Cella U M & Garavaglia V. 2011. Climate warming and the recent treeline shift in the European Alps: the role of geomorphological factors in high-altitude sites. Ambio, 40(3), 264-273.
Macias-Fauria M & Johnson E A. 2013. Warming-induced upslope advance of subalpine forest is severely limited by geomorphic processes. Proceedings of the National Academy of Sciences, 110(20), 8117-8122.
Malanson G P, Resler L M, Bader M Y, Holtmeier F K, Butler D R, Weiss D J, Daniels L D & Fagre D B. 2011. Mountain treelines: a roadmap for research orientation. Arctic, Antarctic, and Alpine Research, 43(2), 167-177.
Mátyás C, Ackzell L & Samuel C J A. 2004. EUFORGEN technical guidelines for genetic conservation and use for Scots pine (Pinus sylvestris). International Plant Genetic Resources Institute, Rome, Italy, 6 pages
Musaoğlu N. 1999. Elektro-optik ve aktif mikrodalga algılayıcılardan elde edilen uydu verilerinden orman alanlarında meşcere tiplerinin ve yetişme ortamı birimlerinin belirlenme olanakları, doktora tezi, İTÜ Fen Bilimleri Enstitüsü, İstanbul.
Palabaş S. 2002. Altındere Valley (Maçka-Trabzon) Subalpine and Alpine Flora, KTU Institute of Science, Master Thesis, Trabzon.
Peet R K. 1981. Forest vegetation of the Colorado Front Range: Composition and dynamics. Vegetatio, Vol. 45, 3-75.
Peili S, Ning W & Rawat G S. 2020. The Distribution Patterns of Timberline and Its Response to Climate Change in the Himalayas. Journal of Resources and Ecology, 11(4), 342-348.
Pereira J & Itami R. 1991. GIS-based habitat modeling using logistic multiple regression – A study of the Mt. Graham red squirrel. Photogrammetric engineering and remote sensing, 57(11), 1475-1486.
Qiu B, Zhong M, Zeng C, Tang Z & Chen C. 2012. Effect of topography and accessibility on vegetation dynamic pattern in mountain-hill region. Journal of mountain science, 9(6), 879-890.
Robakowski P, Pietrzak T, Kowalkowski W & Małecki G. 2021. Survival, growth and photochemical efficiency of silver fir seedlings produced with different technologies. New Forests, 52(6), 1055-1077.
Roberts D W, Cooper S V. 1989. Concepts and techniques of vegetation mapping. General Technical Report INT-US Department of Agriculture, Forest Service, Intermountain Research Station (USA).
Ruiz‐Labourdette D, Nogués‐Bravo D, Ollero H S, Schmitz M F & Pineda F D. 2012. Forest composition in Mediterranean mountains is projected to shift along the entire elevational gradient under climate change. Journal of Biogeography, 39(1), 162-176.
Rundel P W and Yoder B J. 1998. Ecophysiology of Pinus. In Ecology and Biogeography of Pinus. Ed. D.M. Richardson. Cambridge University Press, Cambridge, 296-323
Saatçioğlu F. 1969. Silvikültür I, Silvikültürün Biyolojik Esasları ve Prensipleri. İstanbul Üniversitesi Orman Fakültesi Yayınlar. İstanbul, 323s.
Sabaté S, Gracia C A & Sánchez A. 2002. Likely effects of climate change on growth of Quercus ilex, Pinus halepensis, Pinus pinaster, Pinus sylvestris and Fagus sylvatica forests in the Mediterranean region. Forest ecology and management, 162(1), 23-37.
Salinger M J & Mullan A B. 1999. New Zealand climate: temperature and precipitation variations and their links with atmospheric circulation 1930–1994. International Journal of Climatology: A Journal of the Royal Meteorological Society, 19(10), 1049-1071.
Sanz‐Elorza M, Dana E D, González A & Sobrino E. 2003. Changes in the high‐mountain vegetation of the central Iberian Peninsula as a probable sign of global warming. Annals of Botany, 92(2), 273-280.
Sarris D & Mazza G. 2021. Mediterranean Pine Root Systems Under Drought. In Pines and Their Mixed Forest Ecosystems in the Mediterranean Basin (pp. 129-140). Springer, Cham.
Schmidt-Vogt H. 1977. The Spruce [Picea]. A manual in two volumes. Vol. 1. Taxonomy, geographical distribution, morphology, ecology, and forest communities. The Spruce [Picea]. A manual in two volumes. Vol. 1. Taxonomy, geographical distribution, morphology, ecology, and forest communities.
Seo J W, Salminen H, Jalkanen R & Eckstein D. 2010. Chronological coherence between intra-annual height and radial growth of Scots Pine (Pinus sylvestris L.) in the northern boreal zone of Finland. Baltic Forestry, 16(1), 57-65.
Sisodia P S, Tiwari V, & Kumar A. 2014. Analysis of supervised maximum likelihood classification for remote sensing image. In International conference on recent advances and innovations in engineering (ICRAIE-2014), May 09-11, Jaipur, India.
Smith W K, Germino M J, Hancock T E, Johnson D M. 2003. Another perspective on altitudinal limits of alpine timberlines. Tree Physiol. 23, 1101–1112.
Stage A R. 1976. An expression for the effect of aspect, slope, and habitat type on tree growth. Forest Science, 22:457-460.
Suggitt A J, Gillingham P K, Hill J K, Huntley B, Kunin W E, Roy D B, Thomas C D. 2011. Habitat microclimates drive fine-scale variation in extreme temperatures. Oikos 2011, 120, 1–8.
Sunar F & Musaoğlu N. 1998. Merging multiresolution SPOT P and Landsat TM data: the effects and advantages. International Journal of Remote Sensing, 19(2): 219-224.
Thornthwaite C W. 1948. An approach toward a rational classification of climate. Geographical review, 38(1), 55-94.
Toivonen J M, Gonzales-Inca C A, Bader M Y, Ruokolainen K & Kessler M. 2018. Elevational shifts in the topographic position of Polylepis forest stands in the Andes of southern Peru. Forests, 9(1), 7.
USGS. 2000. Shuttle Radar Topography Mission (SRTM) Global. Distributed by OpenTopography. Accessed: 2020-12-27.
Uzun A. 2002. Flora of Altındere Valley (Maçka-Trabzon) Forest Vegetation, KTU Institute of Science, Master Thesis, Trabzon.
Valentini R, Anfodillo T and Ehlringer J. 1994. Water sources utilization and carbon isotope composition (δ13C) of co-occurring species along an altitudinal gradient in the Italian Alps. Can. J. For. Res. 24, 1575–1578.
Wang X, Qiu B, Li W & Zhang Q. 2019. Impacts of drought and heatwave on the terrestrial ecosystem in China as revealed by satellite solar-induced chlorophyll fluorescence. Science of the Total Environment, 693, 133627.
Weiss, A. 2001. Topographic positions and landforms analysis (conference poster). ESRI International User Conference. San Diego, CA, 9-13.
Weiss D J, Malanson G P and Walsh S J. 2015. Multiscale relationships between alpine treeline elevation and hypothesized environmental controls in the western United States. Annals of the Association of American Geographers, 105(3):437–453.
Wu M, He H S, Zong S, Tan X, Du H, Zhao D, Liu K & Liang Y. 2018. Topographic controls on vegetation changes in alpine tundra of the Changbai Mountains. Forests, 9(12), 756.


