Schlüsselbegriffe: Allometrie, Waldwachstum, Nepal, Soziale Waldbewirtschaftung, Holzdichte, Verjüngung
Abstract
Shorea robusta is one of the most widespread timber species in the forests of southern Nepal. Large parts of Shorea robusta forests of Nepal were degraded in the recent past due to policy conflict between the government and local users. After the introduction of community forestry, these forests have been regenerating gradually and the proportion of juvenile individuals in the forest is now very high. In the absence of biomass models of juvenile individuals, almost all forest inventories are neglecting the contribution of juvenile individuals in total carbon sequestration and storage. To close this knowledge gap, we developed a height and biomass prediction model for juvenile Shorea robusta in Nepal using an individual-based modelling approach. The models were calibrated with data from 110 destructively sampled trees and validated with 45 trees. We tested different model forms to select the best suited height and biomass prediction model. Once the best model form was selected, we calculated several models using different combination of predictor variables (i.e. tree diameter, tree height and wood density). Linear form (coefficient of determination R2 0.80) for height and power form (R2 0.89) for biomass prediction were selected as the best model forms. Product of diameter squared and height (R2 0.91) and product of wood density, diameter squared and height (R2 0.94) for the density-dependent model were the best predictors for biomass model. Due to different input data the predicted biomass by the models of this study differed substantially from biomass predictions using previously developed models of Shorea robusta. Thus, site- and size-specific models are required for accurate predictions of biomass and height of Juvenile of Shorea robusta. The model introduced here is site-specific and its application should be limited to conditions similar to this study.
Zusammenfassung
Shorea robusta ist eine weit verbreitete Baumart in den Wäldern im südlichen Nepal. Große Teile des Shorea robusta Waldes in Nepal wurden in der jüngsten Vergangenheit aufgrund politischer Konflikte zwischen der Regierung und lokalen Nutzern degradiert. Nach Einführung der kommunalen Forstwirtschaft haben sich diese Wälder allmählich verjüngt und der Anteil an Jungbäumen ist jetzt sehr hoch. Weil geeignete Modelle zur Vorhersage des Biomassezuwachses von Jungbäumen fehlen, vernachlässigen derzeit fast alle Waldinventuren den Beitrag der Jungbäume zur Kohlenstoffspeicherung. Um diese Wissenslücke zu schließen, haben wir ein auf Einzelbäumen basierendes Modell zur Schätzung der Wuchshöhe und Biomasse von jungen Shorea robusta aus Nepal entwickelt. Die Modelle wurden mit 110 destruktiv beprobten Jungbäumen kalibriert und 45 Bäumen validiert. Wir testeten verschiedene Varianten der Modelle, um das beste Modell zur Vorhersage von Wuchshöhe und Biomasse zu finden. Nachdem die beste Variante des Vorhersagemodells ausgewählt worden war, wurden mehrere Modelle mit unterschiedlichen Kombinationen der Prädikatorvariablen (Durchmesser, Baumhöhe und Holzdichte) entwickelt. Die beste Modellvariante war eine lineare Funktion (R2 0.80) für die Höhe und eine Potenzfunktion (R2 0.89) für die Biomasse. Das Produkt aus Höhe und Durchmesser zum Quadrat (R2 0.91) und das Produkt aus Holzdichte, Höhe und Durchmesser zum Quadrat (R2 0.94) waren die besten Modelle für die Biomasse. Die Modelle dieser Studie ergeben deutlich unterschiedliche Biomasse von Shorea robusta als die zuvor entwickelten Modelle. Es zeigt sich somit, dass standort- und größenabhängige Modelle wichtig sind für eine genaue Abschätzung der Biomasse von Shorea robusta. Unser Modell ist standortspezifisch und seine Anwendung sollte daher auf Bestände beschränkt werden, die den dieser Studie zugrunde liegenden ähnlich sind.
1. Introduction
Forest biomass is relevant for both forest productivity and climate change (Berndes et al., 2016; Kilpelainen et al., 2014). Regarding forest productivity, more biomass results in a higher yield, while regarding climate change, more biomass has a positive role in minimizing the impact of climate change through sequestering a higher amount of atmospheric carbon dioxide (Chen et al., 2017). Accurate estimation of forest biomass is thus very important. Forest biomass consists of aboveground and belowground biomass (Nonini and Fiala, 2019). Empirical measurements of belowground biomass are time-consuming, costly and difficult, therefore, belowground biomass is often estimated using a constant proportion of aboveground biomass (Zhao et al., 2019; Addo-Danso et al., 2016). This study focusses on aboveground biomass at individual tree level. Aboveground biomass is measured using the direct or the indirect method. In the direct method, individual trees are felled destructively and weighed (Devi and Yadava, 2009; Ravindranath and Ostwald, 2008; Chung-Wang and Ceulemans, 2004). The direct method is more accurate, however, requires a large amount of time and resources (De Gier, 2003). The direct method is often used to develope allometric equations (i.e., an indirect method) that can be applied on larger areas and whole forests (Shrestha et al., 2018; Sharma et al., 2017; Navar, 2009; Segura and Kanninen, 2005). The indirect method estimates biomass without felling the individual trees and thus can be applied to larger forest areas. The indirect method can employ the shape, size (diameter, height), wood density in the form of allometric equations to predicted biomass (Ravindranath and Ostwald, 2008; Montes et al., 2000; Brown et al., 1989).
Allometric models establish a quantitative relationship between two or more variables (Klingenberg, 2016). The variable, that is more difficult to assess, is used as the dependent variable, while variables, that are easy to measure, are used as predictor variables. The allometric relationship is developed based on the accurate and detailed measurement on a small sample of typical individuals which are assumed to hold true for other individuals of a similar size and nature from the similar population. The application of allometric relationship enables estimation and prediction of different variables of individual trees and forest (Altanzagas et al., 2019; Daba and Soromessa, 2019). In published allometric models, tree height is predicted from stem diameter (Sharma, 2009; Huang et al., 1992) and biomass is predicted from stem diameter (Chapagain et al., 2014; Ong et al., 2004; Clough et al., 1997), stem diameter and height (Chapagain et al., 2014; Subedi and Sharma, 2012), stem diameter, height and wood density (Shrestha et al., 2018; Sharma et al., 2017). Most of the available biomass models were developed using data from large trees (Shrestha et al., 2018; Sharma et al., 2017; Nam et al., 2016; Huy et al., 2016; Clough et al., 2016; Chave et al., 2014; Paul et al., 2013; Blujdea et al., 2012; Subedi and Sharma, 2012; Navar, 2009; Chave et al., 2005; Tamrakar, 2000). Contribution of large-sized trees to biomass and carbon storage is high, but the contribution of juvenile (defined as a plant ≥30 cm in height and <5 cm in diameter at 10 cm above ground surface) individuals is not negligible. Juvenile individuals can contribute around 5% biomass in forest depending on successional stage (Francis, 2000). Juveniles do not only contain biomass and carbon, but are also an important indicator of sustainability of forest management, reducing soil erosion and a predictor variable in analysing neighbourhood competition (Ter-Mikaelian and Parker, 2000). Despite their importance, few studies have focussed on juvenile trees. Chaturvedi et al. (2012) developed the multispecies biomass model for 47 dry tropical woody species at the juvenile stage. Chapagain et al. (2014) developed allometric biomass models to estimate juvenile biomass of three tropical tree species (Shorea robusta, Acacia catechu and Terminalia tomentosa). BK et al. (2019) developed the allometric biomass model for juveniles of Rhododendron arboreum from the temperate region of Nepal.
Shorea robusta (C.F. Gaertn.,) (family Dipterocarpaceae) is a large tree reaching 30-50 m height and 3-3.5 m diameter at breast height (dbh) (Chitale and Behera, 2012; Jackson, 1994). It is found across Nepal, India, Bangladesh and Myanmar (Gautam and Devoe, 2006; Stainton, 1972). In Nepal, it grows from 120 m to 1200 m elevation, but is more common at elevation lower than 800 m (Sah, 2000; Jackson, 1994). The contribution of Shorea robusta in total standing volume in Nepal is 19.28% (31.76 m3/ha) with a stem number of 65 trees per hectare (≥10 cm dbh), covering 15.27% of forest area (DFRS, 2015). These most recent estimate of standing volume, stem number and coverage of Shorea robusta are lower than the numbers reported in DFRS (1999). The different parts of Shorea robusta trees have been extensively used such as the stem as timber, construction material and fuelwood (Jackson, 1994), the leaves as fodder (Kibria et al., 1994) and dining plates (Kora, 2019), the resin as medicine of dysentery and gonorrhoea (Joshi, 2003).
Most of the Shorea robusta forest of Nepal was degraded in the recent past due to policy conflict between the government and local users (Sah, 2000; Land Resources Mapping Project, 1986). But after the introduction of community forestry system, these forests have been rejuvenated gradually (Paudel and Sah, 2015) and the proportion of the juvenile plants is high. Ample research in community forest (CF) of Nepal has demonstrated the positive impact of CF on forest conservation and regeneration (Bhattarai and Conway, 2008) and local livelihoods (Chhetri et al., 2012). Indeed, this positive effect has also raised the attention for estimating the biomass of juvenile plants to promote ecological sustainability in CF of Nepal. CF, one of the most successful participatory forestry programs implemented in Nepal, is joint venture of government and local user for conservation, protection, management and utilization for forest resources (Aryal et al., 2019; Nuberg, et al. 2019; Luintel et al., 2018). In Kankali CF (study area of this study), the average stand density of the CF is 7687 ha-1 whereas stand density with trees >10 cm dbh is 572 ha-1 and trees <10 cm dbh is 7115 ha-1. The biomass and carbon measurement guideline of Nepal has recommended the allometric equation of Tamrakar (2000) (log biomass = a +b log (dbh)) to estimate the biomass/carbon of plants having dbh <5 cm, although this equation was developed using few data from small-sized trees. This equation includes a large number of data from large sized trees and a small number of data from small sized trees. In the case of Shorea robusta, the equation was developed using the data ranging from 3 cm to 20 cm dbh (Tamrakar, 2000). Biomass and carbon estimation from the equation of Tamrakar (2000) might induce significant errors in the case of small-sized plants. Another model for estimation of juvenile biomass of three tropical tree species including Shorea robusta is developed by Chapagain et al. (2014) for western Nepal. The model of Chapagain et al. (2014) was developed using the data from the three CFs in Bardiya district (28.3102° N and 81.4279° E) of province number five of Nepal (Figure 1). Even though, the study area of Chapagain et al. (2014) and the study area of this study lies on southern Nepal, the climate, physiography, stand density, site quality and human disturbance differs. The average annual precipitation of Bardiya district is 1118 mm (Chapagain et al., 2014) while the average annual precipitation of Chitwan district (study area of this study) is 1916 mm (DFO Chitwan, 2017). The altitudinal range of Bardiya district is 138 to 1279 m above mean sea level (Chapagain et al. 2014), while the altitudinal range of Chitwan district is 100 to 815 m above mean sea level. A model developed for a specific site may not be suitable for another site with different climate, physiography, stand density, site quality and human disturbance.
To minimize the error in biomass and carbon estimation, species-specific and size-specific equations including juvenile individual is required. Therefore this study aimed to develop allometric equation to predict height and biomass for juveniles of Shorea robusta. To achieve this aim, we selected the best form of the model out of several available height and biomass prediction models. In the case of biomass model, we further improved the model using the different combination of predictor variables. We further categorized the developed models into wood density-independent and wood density-dependent, to make our models easier applicable depending on the availability of predictor variables. We validated these developed models using a subset of data which was not used in the model development. We also compared our biomass models with the previously developed biomass models of Shorea robusta.
2. Materials and Methods
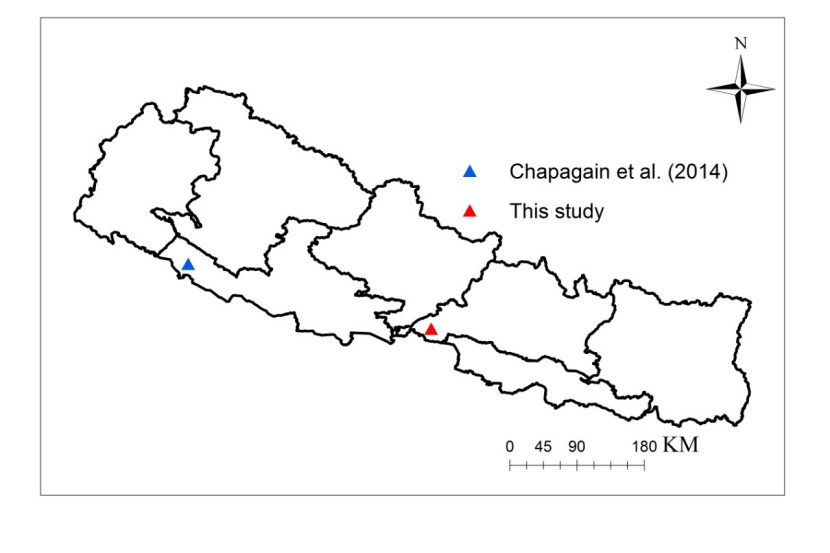
Figure 1: Map of Nepal showing the location of this study and the study site of Chapagain et al. (2014). / Abbildung 1: Karte von Nepal, die das Untersuchungsgebiet dieser Studie und das Untersuchungsgebiet der Studie von Chapagain et al. (2014) zeigt.
2.1 Study Area
The study was conducted in Kankali CF of Khairahani Municipality of Chitwan district Nepal (27.5291° N, 84.3542° E) (Figure 1). The forest coverage in the district is 63.25% (DFRS, 2015) and the 14.94% forest of the district is managed by 87 community forest user groups (CFUGs) in the form of CF including 43,313 households (DOF, 2017). The altitude of the district ranges from 100 m to 815 m above mean sea level. The average minimum and maximum temperature is 9.4 ºC in January and 33.7 ºC in June and average annual rainfall is 1916 mm (DFO Chitwan, 2017). The studied forest is 760 ha in area and has been managed by local CFUG since 1995. The CFUG is implementing different forest management activities like weeding, cleaning, climber cutting, pruning, thinning and other selective cutting. The forest type is natural and mixed in composition with Shorea robusta as dominant species. Terminalia belerica, Terminalia tomentosa and Terminalia chebula are other associate species of the forest. According to the operational plan, the CF has good quality stands and crown coverage is more than 65%. A part of this forest had been studied for carbon sequestration and a monitory value of carbon credit had been paid through a REDD+ pilot project in Nepal funded by a Norwegian development aid agency (NORAD) (Saito-Jensen et al., 2014).
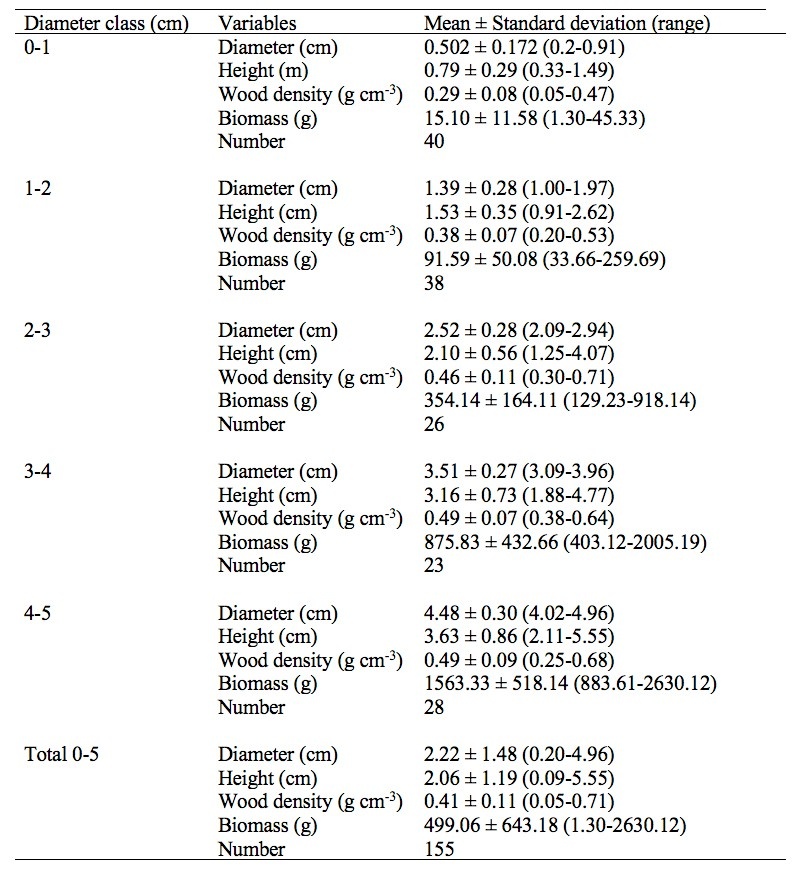
Table 1: Descriptive statistics of the variables used for modelling the juvenile aboveground biomass of Shorea robusta. / Tabelle 1: Zusammenfassung der Shorea robusta Jungbäume, die für die Modellierung der oberirdischen Biomasse verwendet wurden.
2.2 Sampling and Measurement
The operational plan of the CF was used to detect the variation in the size of the individuals of Shorea robusta (Operational Plan, 2019). 155 individual juveniles were selected purposively from the whole study area to represent existing variation of the site conditions, stand density, tree size (Chapagain et al., 2014; Adinugroho and Sidiyasa, 2006; Dorado et al., 2006; Edwards Jr et al., 2006). The individuals with a broken top, abnormal stem, diseased, dead and dying were excluded from measurement. We collected data on measured parameters (diameter, height, stem volume, total fresh weight of stem, branches and leaves, sample fresh weight of stem, branch and leaves) and derived parameters (total dry weight of stem, branch and leaves and wood density). Vernier Calliper (precision 1 mm) was used to measure the diameter of each juvenile at 10 cm above the ground level by following the method of Chapagain et al. (2014) and BK et al. (2019). Hereafter the diameter is referred as D. Then, the juvenile individual was felled by hand saw. Total height (H) was measured from base to tip of the juvenile using linear tape (precision 1 mm). A separate weight of stem, leaves and branches were recorded (precision 0.1 gram). At least 100 gram (g) of stem, leaves and branches were weighed and placed in a labelled bag and transported to the laboratory as sample for oven dry weight. If a part (stem or branch or leaves) of the juvenile individual was less than 100 g, whole part was used for drying the samples. The fresh volume of the stem sample was determined using the principle of water displacement (BK et al., 2019; Shrestha et al., 2018; Chapagain et al., 2014; Chaturvedi and Khanna, 2011). The samples (leaves, branches, stem separately) were dried on an oven at 90˚C till the constant weight was achieved to determine the dry weight of the sample. The weight of the samples was first recorded after 24 hours and then repeated at the interval of 12 hours. The wood density (ρ) was determined as the ratio of the dry weight of stem sample and its fresh volume (Equation 1). The total dry weight of leaves, branches and stem was determined using the ratio of dry weight and fresh weight of samples of leaves, branches and stem respectively. The total dry biomass of each juvenile individuals was calculated by adding the dry biomass of leaves, branches and stem. The descriptive statistics of the data used for modelling is given in Table 1.
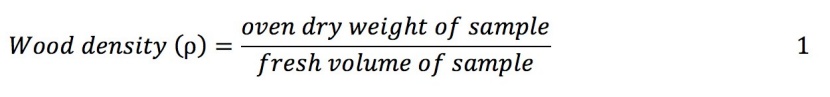
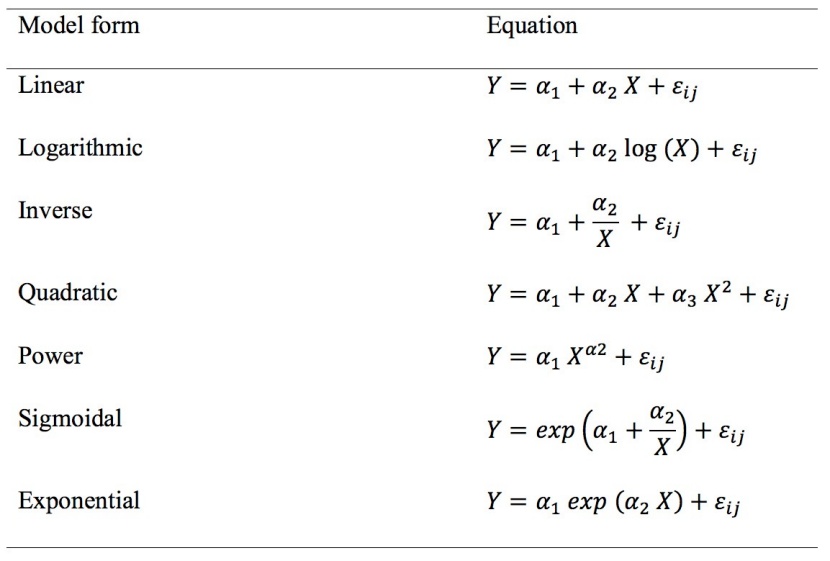
Table 2: Different forms of models and their equations used in height and aboveground biomass modelling of juveniles of Shorea robusta (Y is dependent variable and X is predictor variable. / Tabelle 2: Modellformen und Gleichungen, die bei der Modellierung der Wuchshöhe und der oberirdischen Biomasse von Jungbäumen der Shorea robusta verwendet wurden (Y ist abhängige Variable und X Prädikatorvariable).
2.3 Modelling approach
We fitted different forms of models including linear, logarithmic, inverse, quadratic, power, sigmoid and exponential (Table 2) to our data to select the best height and biomass prediction models. For height prediction, we fitted the models with height as the dependent variable and diameter as the predictor variable. For biomass prediction, we fitted the models with biomass as the dependent variable and dimeter as the predictor variable. The parameters and fit statistics for each model were estimated in R using the lm, nls and nlsLM function in the minpack.lm package (R Core Team, 2017), and evaluated using different criteria including significance of estimated parameters (at 5% level of significance); coefficient of determination (R2; higher values indicate better models); root mean squared error (RMSE; lower values indicate better models) (Montgomery et al., 2001); and Akaike Information Criterion (AIC; lower values indicate better models) (Akaike, 1972; Burnham and Anderson, 2002). Distribution of residuals was also considered in selecting the best model.
Once the best form of biomass model was selected, a different combination of predictor variables was used in that form of biomass model. The different combinations of predictor variables used were diameter alone (D), product of diameter and height (DH), product of square of diameter and height (D2H), product of wood density, diameter and height (ρDH) and product of wood density, square of diameter and height (ρD2H) (BK et al., 2019; Shrestha et al., 2018; Chapagain et al., 2014).
2.4 Validation
The whole data (n = 155) was split into calibration data (n = 110) and validation data (n = 45). The validation data was used in the best-selected model to analyse the model performance. We estimated the correlation coefficients between the predicted values and observed value of validation data. Correlation coefficient was categorized as very high (>0.9), high (0.7-0.9), moderate (0.5-0.7), low (0.3-0.5) and negligible (0-0.3) (Mukaka, 2012). Plots of predicted versus observed values were also generated to evaluate whether the model prediction is similar to observed data or not. Furthermore, we used a paired sample t-test to test whether there was a significant difference between observed and predicted values at 5% level of significance.
2.5 Comparison of validated models with previously developed biomass models
We compared our biomass models with two categories of previously developed biomass models. The first category of models was biomass prediction models of juvenile individuals of Shorea robusta. Chapagain et al. (2014) had developed eight biomass models for juvenile individuals of three tropical tree species including Shorea robusta in Nepal. We compared our models (based on D, D2H and ρD2H) with three models of Chapagain et al. (2014) (Equation 2, 3 and 4) which predicts the biomass of Shorea robusta based on D, D2H and ρD2H.
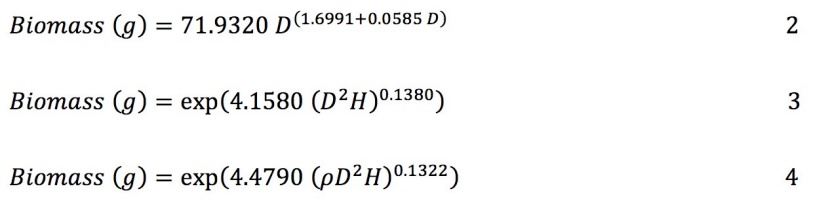
Where D is diameter (cm) measured at 10 cm above the ground level, H is total height (m) and ρ is wood density (g cm-3).
The second category of models were biomass prediction models of large sized trees of Shorea robusta. Sharma and Pukkala (1990) (Equation 5, 6), Tamrakar (2000) (Equation 7) and Subedi (2017) (Equation 8, 9) had developed biomass models for Shorea robusta in Nepal. These models were based on dbh (cm) and/or height (m) of the Shorea robusta, however, our models were based on diameter at 10 cm above the ground level and height. We developed a simple power function model to predict the dbh from the diameter at 10 cm above the ground level (Equation 10).
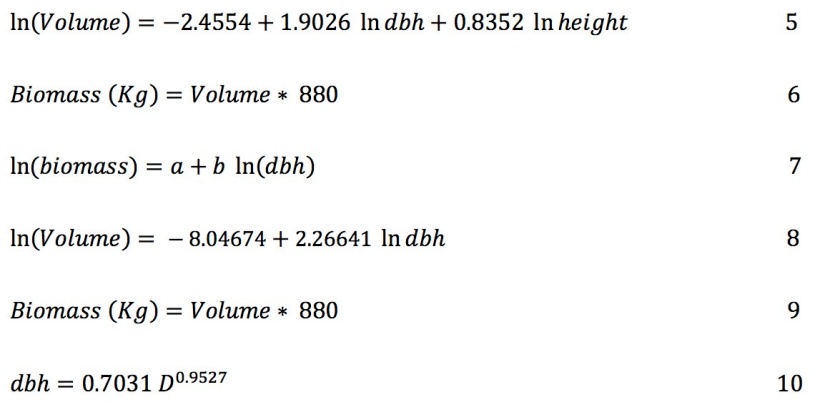
Where dbh is diameter at breast height at 1.3 m above ground (cm) and D is diameter (cm) at 10 cm above the ground level.
For comparison, we predicted the biomass using the models of Chapagain et al. (2014), Sharma and Pukkala (1990), Tamrakar (2000), Subedi (2017) and the models developed in this study. Then we plotted the predicted biomass against the predictor variables (Figure 5). Paired sample t-test was used to test whether the predicted biomass by the model of this study and other previously developed models was same. Correlation coefficient (r) was used to evaluate the relationship between the models developed in this study and each of the previously developed models.
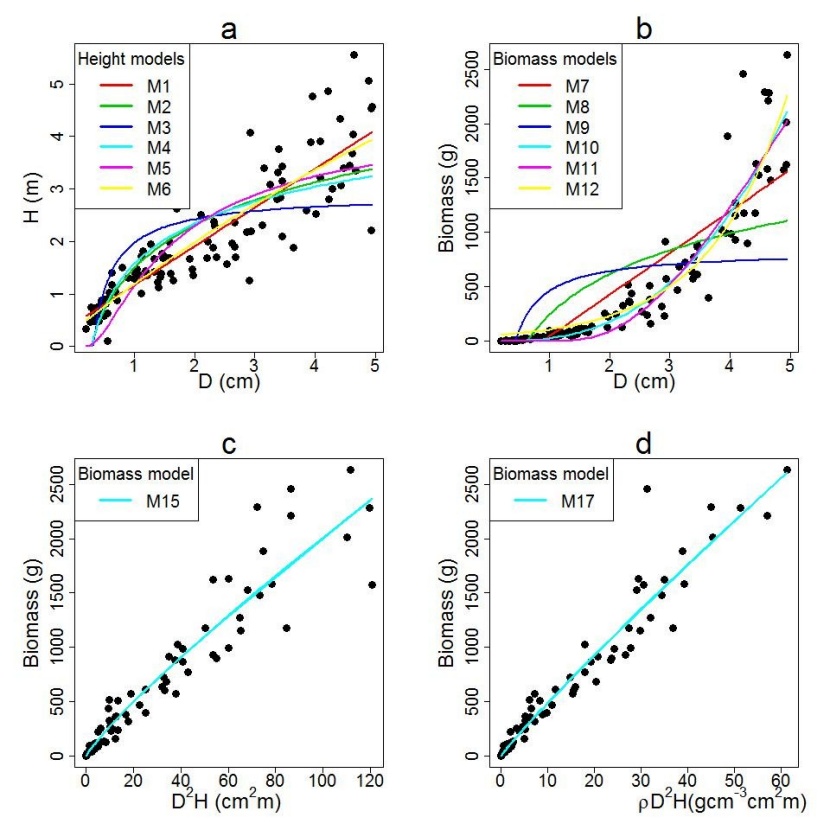
Figure 2: Model predictions of Shorea robusta; (a) tested tree height models, (b) tested aboveground biomass models, (c) best performing biomass model using diameter at 10 cm above ground (D) and tree height (H) and (d) best performing biomass model using D, H, and wood density (ρ). / Abbildung 2: Modellschätzungen von Shorea robusta; (a) getestete Baumhöhen-Modelle, (b) getestete Biomasse-Modelle, (c) bestes Biomasse-Modell unter Verwendung des Durchmessers 10 cm über dem Boden (D) und der Baumhöhe (H) und (d) bestes Biomasse-Modell unter Verwendung von D, H und Holzdichte (ρ).
3. Results
The result showed that the stem, leaf and branch biomass of juvenile individual covers 83%, 11% and 6% of total biomass respectively. Leaf and branch biomass of juvenile covers 12% and 7% of total stem biomass. Similarly, branch biomass of juvenile covers 57% of leaf biomass.
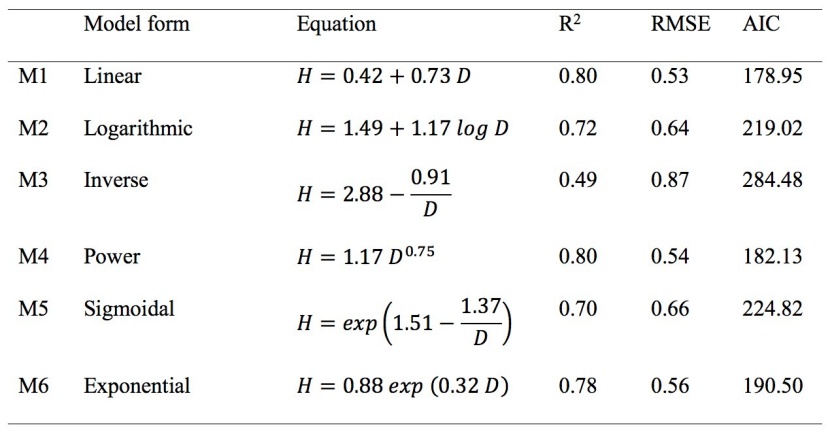
Table 3: Tested height models with equation and coefficients, their respective coefficient of determination R2, root mean square error (RMSE) and Akaike’s Information Criterion (AIC) used diameter for juvenile Shorea robusta. H is tree height and D tree diameter 10 cm above ground. / Tabelle 3: Getestete Baumhöhen-Modelle, deren Gleichungen und Koeffizienten mit jeweiligen Bestimmtheitsmaß R2, RMSE und AIC unter Verwendung des Durchmessers von Shorea robusta Jungbäumen (H ist die Höhe und D der Stammdurchmesser).
3.1 Model for height prediction
All model parameters were significant at a 95% confidence interval except one parameter of the quadratic form of the model (p = 0.59), which we excluded from further analysis. The inverse form of the model only described 49% of the variation in total height with highest RMSE and AIC than other models (Table 3). Logarithmic form of model overestimated the height for smaller juveniles and underestimated for larger juveniles, however, the sigmoidal model underestimated the height for smaller juveniles and overestimated the height of larger juveniles (Figure 2a). The exponential model overestimates the height for smaller juveniles (Figure 2a). Linear and power form of the model described more than 80% of the variation in total height. Furthermore, the linear and power form of the model produced smaller RMSE and AIC than other models. Out of the remaining two models, the linear model described higher variability in height with a lower RMSE and AIC than the power model (Table 3). Figure 3a showed negligible curvature and outliers while plotting the unstandardized residuals against the predicted height. The absence of curvature and outlier in the linear model suggests the absence of local bias. Thus, we selected the linear model (M1, Table 3) for predicting height from the diameter, though the difference of fit statistics between the linear model and power model was very small.
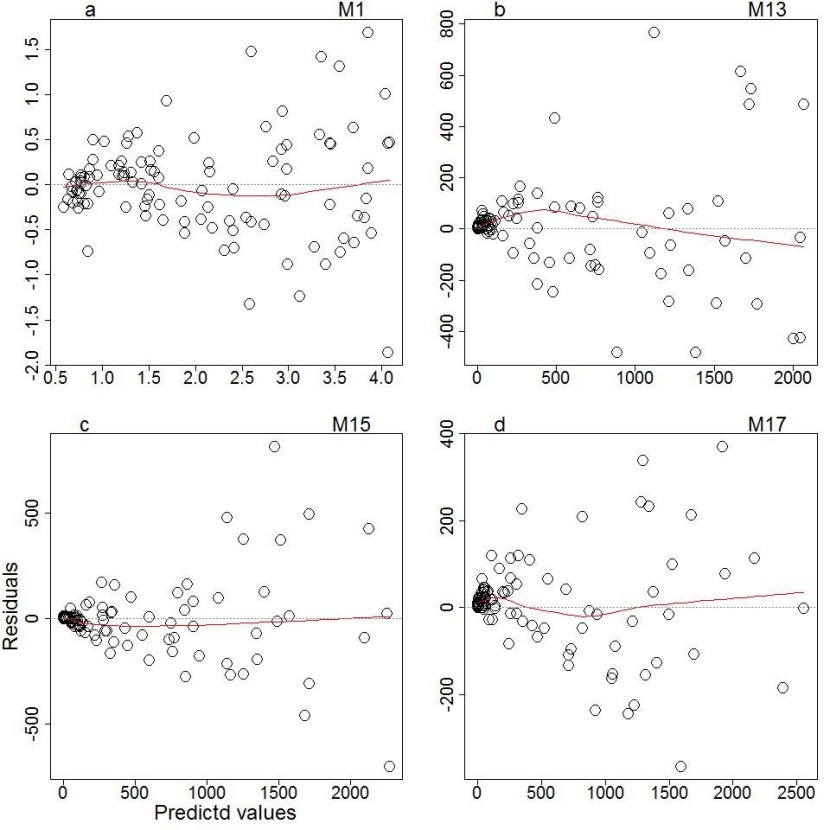
Figure 3: Distribution of residuals for four selected models for Shorea robusta, M1 predicts tree height, M13, M15 and M17 predicts aboveground biomass. / Abbildung 3: Verteilung der Residuen für vier ausgewählte Modelle für Shorea robusta, M1 prognostiziert die Baumhöhe, M13, M15 und M17 prognostizieren die oberirdische Biomasse.
3.2 Model for biomass prediction
We employed similar criteria like height prediction model to select the best biomass prediction model. The parameter estimates of the quadratic model were non-significant (p = 0.06) at a 95% confidence interval and therefore excluded from further processing. The inverse and logarithmic models describe low variability in biomass of juveniles (Table 4). Linear model overestimated the biomass for smaller juveniles and underestimated for larger juveniles (Figure 2b). The sigmoid model underestimated and exponential model overestimated the biomass for smaller juveniles (Figure 2b). The power model described higher variability in biomass of juveniles with minimum RMSE and AIC than other models (Table 4). Thus, power model was selected for predicting biomass of juveniles, though the difference in fit statistics among the power, sigmoid and exponential models was very small.
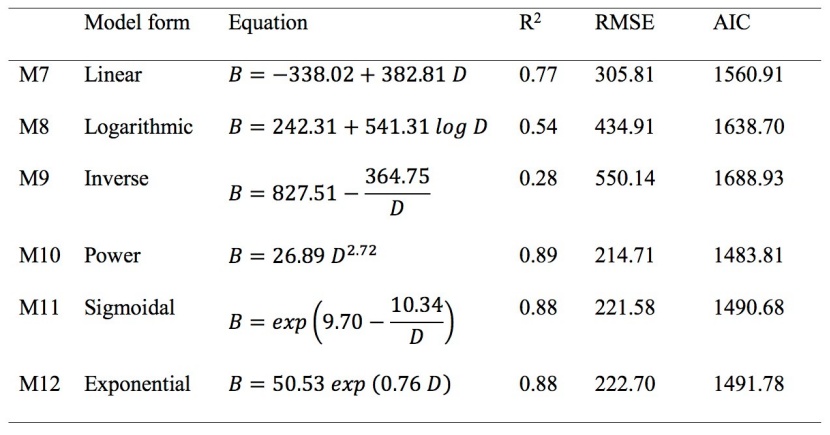
Table 4: Tested biomass models with equation and coefficients, their respective coefficient of determination R2, root mean square error (RMSE) and Akaike’s Information Criterion (AIC) used diameter for juvenile Shorea robusta. B is tree biomass and D tree diameter 10 cm above ground. / Tabelle 4: Getestete Biomasse-Modelle, deren Gleichungen und Koeffizienten mit jeweiligen Bestimmtheitsmaß R2, RMSE und AIC unter Verwendung des Durchmessers von Shorea robusta Jungbäumen (B ist die Biomasse und D der Stammdurchmesser).
We also examined the power form of the model using a different combination of predictor variables to optimize the predictive capacity of the model (Table 5). The estimated parameters for five different categories of the power model were significant. In density-independent categories, the model with D2H demonstrates the highest R2, lowest RMSE and AIC than others. On the other hand, the model with ρD2H as predictor variable demonstrates the best fit (highest R2, lowest RMSE and AIC) in the group of density-dependent models (Table 5). The unstandardized residuals against the fitted values with a smooth superimposed curve for power model of biomass prediction (M13, M15 and M17) is presented in Figure 3b,c,d. Here we examined for evidence of curvature and outliers. The graph of power model (M13, M15 and M17) showed minimum error in M17 with negligible curvature and outliers. The absence of curvature in these models suggests the absence of local bias in the model. Overall, the model (M17) with the inclusion of wood density in the predictor variable (ρD2H) best described the variations in biomass of juveniles of Shorea robusta. The curve of the model M15 and M17 overlaid on the observed data showed a good match to the data (Figure 2c, d).

Table 5: Variables and the estimated coefficients used for biomass models of juveniles of Shorea robusta in power form with their respective R2, RMSE and AIC (D is stem diameter, H height and ρ wood density). / Tabelle 5: Variablen und die geschätzten Parameter der Biomasse-Modelle von Jungbäumen der Shorea robusta der Potenzform mit jeweiligen R2, RMSE und AIC (D ist der Stammdurchmesser, H Höhe und ρ Holzdichte).
3.3 Validation
By using the generated models for prediction of height (M1, Table 3) and biomass (M13, M15 and M17, Table 5), we executed prediction runs based on the validation dataset. The correlation coefficients between observed and predicted height was high (r = 0.87) (Figure 4a) and between observed and predicted biomass was very high (r = 0.91 to 0.97) (Figure 4b, c, d). The paired sample t-test showed that the observed and predicted values of height (Figure 4a) and biomass (Figure 4b, c, d) did not differ statistically (p>0.05).
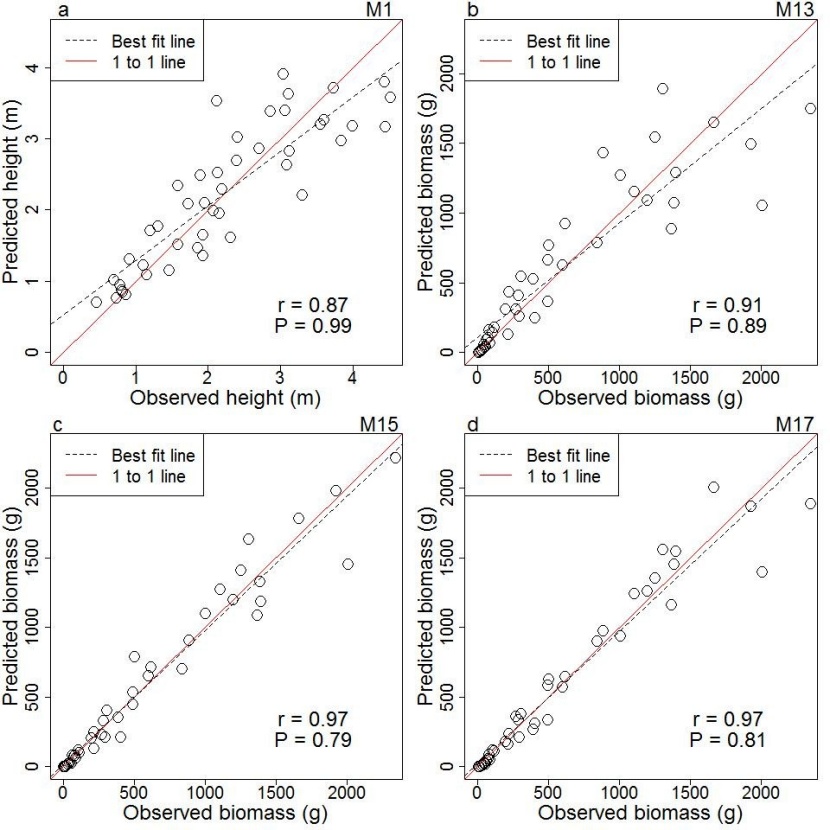
Figure 4: Relationships of observed and predicted values of four selected models of Shorea robusta (r = correlation coefficient and p = p-value); (a) model M1 predicts height from diameter; (b) model M13 aboveground biomass based on diameter only; (c) model M15 predicts biomass prediction model using product of diameter square and height; (d) model M17 predicts biomass prediction model from product of wood density, diameter squared and height. / Abbildung 4: Zusammenhang zwischen beobachteten und geschätzten Werten ausgewählter Modelle von Shorea robusta (r = Korrelationskoeffizient und p = p-Wert); (a) M1 Modell berechnet Höhen mit Durchmesser; (b) M13 Modell berechnet Biomasse ausschließlich mit Durchmesser; (c) M15 Modell berechnet Biomasse aus dem Produkt von Höhe und Durchmesser zum Quadrat; (d) M17 Modell berechnet Biomasse aus dem Produkt von Holzdichte, Höhe und Durchmesser zum Quadrat.
3.4 Comparison of validated models with previously developed biomass models
Juvenile biomass predicted by the model of this study (M13, M15 and M17) and the previous models of Sharma and Pukkala (1990), Tamrakar (2000), Chapagain et al. (2014) and Subedi (2017) showed a higher degree of positive correlation (r = 0.97 to 0.99). The predicted biomass by the model of this study (M13, M15 and M17) was significantly different (p<0.05) with the predicted biomass of each of the previous models except one model of Chapagain et al. (2014) which is based on D (p = 0.08) (Equation 2).
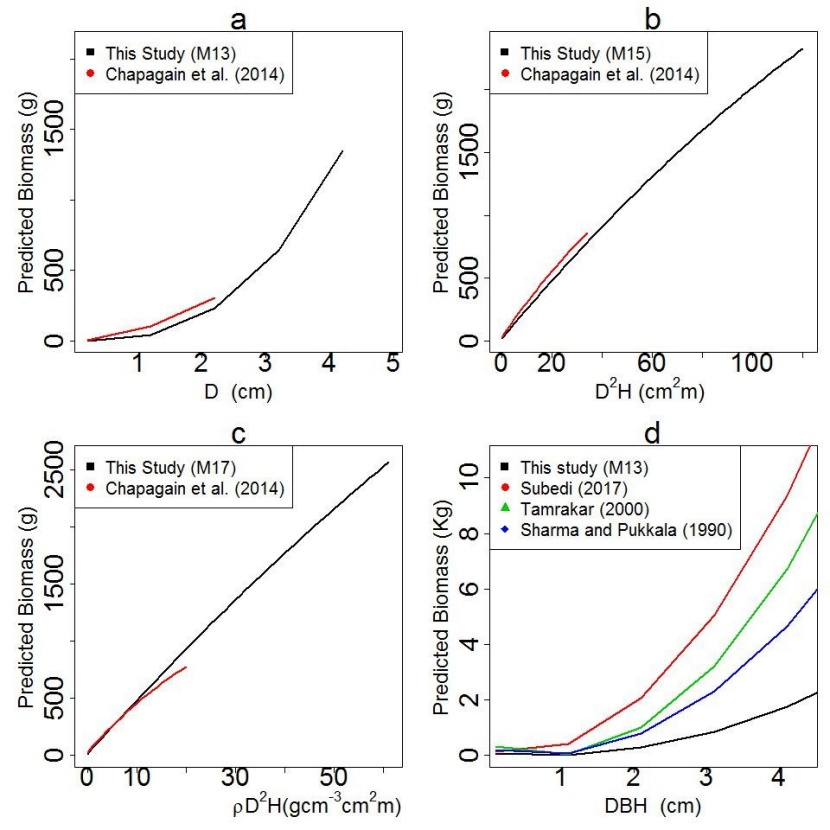
Figure 5: Comparison of the models introduced in this study with published models of Shorea robusta with different combinations of predictor variables (D, D2H, ρD2H, dbh) (a) biomass models based on diameter 10 cm above ground (D) only; (b) biomass models based on product of diameter squared and height only; (c) biomass models based on product of wood density, diameter squared and height; (d) biomass model based on diameter at breast height (dbh) (M13 has power form using the predicted dbh in cm and biomass in kg). / Abbildung 5: Vergleich unserer Modelle mit früheren Modellen der Shorea robusta mit verschiedenen Kombinationen von Prädikatorvariablen (D, D2H, ρD2H, dbh) (a) Biomasse-Modelle, die nur Durchmesser (D) verwenden; (b) Biomasse-Modelle, die auf dem Produkt von Höhe und Durchmesser zum Quadrat basieren; (c) Biomasse-Modelle, die auf dem Produkt von Holzdichte, Durchmesser zum Quadrat und Höhe basieren; (d) Biomasse-Modelle, die den Durchmesser in Brusthöhe (dbh) verwenden (Modell M13 ist die Potenzfunktion mit geschätztem dbh in cm und Biomasse in kg).
4. Discussion
This study showed the best performance of a liner model (M1) in diameter-height allometry. This result is inconsistent with the results of Sharma (2009) and Thapa et al. (2013), who reported a non-linear relationship in diameter-height allometry. As the growth in diameter and height is linear in nature during the juvenile stage of individual trees, the linear function may have explained a higher amount of variation in height. As the individual tree increases in age, the growth in height speed up until the individual tress reached the middle stage (Chaturvedi and Khanna, 2011), however, there will be less growth in diameter. As the individual trees reach the middle stage, the height growth tends to decrease and diameter growth tends to increase. The different rates of growth of individual tree at different stages of life introduced a non-linear relationship between diameter and height. The non-linear relationship of diameter-height allometry in large-sized individual trees has been well established (Deng et al., 2019; Ng'andwe et al., 2019; Subedi et al., 2018; Khadka et al., 2015).
Similar to studies (BK et al., 2019; Kebede and Soromessa, 2018; Sharma et al., 2017; Shrestha et al., 2018; Pastor et al., 1984), we found a simple power function as the best form of the model to predict the aboveground biomass of juvenile individual of Shorea robusta. Biomass of individual trees correlates non-linearly with individual tree variables, however, the form of non-linearity differs with species, stand density, site index, geographic regions and climate (Luo, 2020; Xing et al., 2019; Nam et al., 2016; Chave et al., 2014; Chapagain et al., 2014; Chave et al., 2005).
Biomass of individual trees is the sum of the biomass of stem, branches and foliage, however, a major portion of the biomass is contributed by stem of the individual trees (Ketterings et al., 2001). Therefore a number of biomass prediction models have found diameter as the best predictor variable (Pastor et al., 1984), which is not consistent with the result of this study. We found weakest performance while using diameter alone (M13) in the biomass prediction model (Table 5) compared to the models which uses diameter, height and wood density. As individual juveniles having the same stem diameter may vary in height, they may also vary in biomass. Therefore, the model with diameter and height as the predictor variables explained more variation in biomass. We observed this in our study as the model M14 and M15 performed better than model M13 which is consistent with many other studies (Xing et al., 2019; Kebede and Soromessa, 2018; Shrestha et al., 2018; Nam et al., 2016). As the individual juveniles having the same stem diameter and height may vary in wood density, they may also vary in biomass. Therefore, the model with diameter, height and wood density as the predictor variables explained more variation in biomass (Shrestha et al., 2018; Alvarez et al., 2012; Chaturvedi et al., 2012). This was also proved in our study as the model M16 and M17 performed better than model M13, M14 and M15. The model M17 performed best from the group of density-dependent models. The wood density does not improve the model always for example, Chapagain et al. (2014) found that the model with diameter and height better than the model with diameter, height and wood density. We tested slenderness coefficient as predictor variable, however, it did not improve the model. Our models which were developed using ordinary least square regression showed a good fit to the data, however, there is still possibility of improving these models using mixed effect modelling approach. We could not use mixed effect modelling approach because the data were collected only at one time using individual juveniles selected purposively.
Model validation is one of the important step in the development of models as it increases the credibility and confidence about the predictive capacity of the models (Soares et al., 1995; Vanclay and Skovsgaard, 1997). A high (r=0.87) to very high (r=0.97) correlation coefficients between observed and predicted values suggested that our models are well validated (Figure 4). This validation was further supported by non-significant difference at a 95% confidence interval in paired sample t-test. It shows that the models selected in this study are capable to predict as accurately as field-measured biomass.
Biomass predicted by model of this study (M13) and Chapagain et al. (2014) using D as predictor variable (Equation 2) did not differ significantly, however, the biomass predicted by the model of this study (M15, M17) and Chapagain et al. (2014) using D2H and ρD2H as predictor variables (Equation 3, 4) differed significantly. The reason behind this difference may be the high variation in height and wood density of the juveniles that are growing in two different geographical areas thus, differences in the stand density, site quality, topography and climate. The average and range values of height and wood density of juveniles used in this study was higher than those used in Chapagain et al. (2014). The differences in predicted biomass was small for smaller juveniles, however, difference increased with an increase in values of predictor variable (Figure 5b, c).
As expected, the predicted biomass by our model (M13) and predicted biomass by previous models of Sharma and Pukkala (1990), Tamrakar (2000) and Subedi (2017) showed a significant difference (p<0.05) (Figure 5d). Two reasons may explain these differences. The first reason may be the differences in the size of the trees used in the model development. Our study used juvenile individuals of Shorea robusta (D = 0.20 cm to 4.96 cm) while Sharma and Pukkala used larger sized individuals of Shorea robusta (dbh = 12.70 cm to 144.50 cm). The dbh of Shorea robusta trees used in the model of Subedi (2017) ranged between 30.10 cm to 108.50 cm. The second reason may be the extent of area covered during sample data collection. The data for Sharma and Pukkala (1990) was collected from the whole range of distribution of Shorea robusta whereas the data for Subedi (2017) was collected from two districts (Kailali and Kanchanpur) of far western Nepal. The data for the present study was collected from the one community forest of Chitwan district of central Nepal.
As the altitudinal, climatic and species variation is very high in Nepalese forest, a universal model for all size, site and species is not suitable. The model developed from the data of large sized individual may not predict the biomass of small sized individual and the model developed from one site of the country may not be suitable in another site. Therefore, new models that are size specific, site specific and species specific are required for accurate prediction of individual tree biomass.
Data collected using destructive sampling method were used to develop the models and the number of juvenile individuals used (n=155) in this study was larger than those used in other studies (BK et al., 2019; Shrestha et al., 2018; Subedi and Sharma, 2012; Sharma, 2011) which ranged from 27 to 66 individuals. Data from smaller number of sampled trees have also performed good results in biomass model development if they have been collected from destructively sampled trees representing potential sources of variation. The large-sized individual showed relatively high residuals, however, the overall distribution of residual was random (Figure 3). Similar trend of residuals have also been observed by Bk et al. (2019). The absence of systematic trend or bias in the residuals also confirms the higher degree of precision in our models. The precision of the model have also been proved from the validation of the models (Figure 4). The models developed in this study are applicable to a variety of predictor variables. For example, the biomass model is applicable if only the diameter is available, or diameter and height is available or diameter, height and wood density is available. The models with wood density provide higher precision, however, require more resources and time to determine wood density.
The direct application of the models developed in this study is to predict and estimate the height and biomass of juvenile individual of Shorea robusta. These models may help to minimize the lack of biomass models for the juvenile stage which has caused a substantial underestimation of the total biomass and carbon in forests. The models may contribute to adding the economic value of carbon trading from juvenile individuals. Prediction and estimation of biomass of juvenile individuals are used in quantification of forest fuels, assessing the potential of young stands as a fibre source and indicating net primary production (Wagner and Ter- Mikaelian, 1999). The juvenile individual biomass may be used as a response variable in evaluating the impact of neighbourhood competition (Ter-Mikaelian and Parker, 2000). In addition to these applications, juvenile individuals play an important role in balancing forest ecosystems.
5. Conclusions
Among several forms of the model tested, a linear form for height prediction and power form for biomass prediction performed better than other forms of the model. Different combinations of predictor variables further improved the biomass model. Product of square of diameter and height (R2 = 0.91) for density-independent and product of wood density, square of diameter and height (R2 = 0.94) for density-dependent model showed the strongest fit statistics and smaller variations of the residuals. The developed models were well validated as the correlation coefficients between observed and predicted values ranged from high (0.87) to very high (0.97) and the difference between observed and predicted values was non-significant. As the predicted biomass by the models of this study differed significantly with the predicted biomass by the previously developed models of Shorea robusta, site and size specific models are required for accurate prediction of biomass of Shorea robusta. Future research is recommended from a wider geographical area including the variables that describes site quality, stand density, growth stage, climate and species distribution to make the model more applicable in wider areas.
Funding
This study was funded by Nepal Academy of Science and Technology.
Conflict of Interest
The authors declare that they have no conflict of interest.
Author contribution
The first author designed a research concept, carried out data collection, developed models and drafted the manuscript. The second author played a coordinating role in model development, manuscript writing and edited the manuscript thoroughly.
Acknowledgements
The authors express their gratitude to the user of the Kankali CF. The authors also thank to field research crew members: Prakash Adhikari and Makkhan Gurung. The authors also thank the Institute of Forestry, Pokhara Campus Pokhara, for allowing to use its laboratory. The authors are thankful to two anonymous reviewers for their constructive comments and suggestions.
6. References
Addo-Danso, S.D., Prescott, C.E., Smith, A.R. 2016. Methods for estimating root biomass and production in forest and woodland ecosystem carbon studies: A review. Forest Ecology and Management 359:332-351.
Adinugroho, W.C.D., Sidiyasa, K. 2006. Biomass estimation model of above-ground mahogany (Swietenia macrophylla) tree. Jurnal Penelitian Hutan dan Konservasi Alam 3(1):103-117.
Akaike, H. 1972. A new look at statistical model identification. IEEE Trans Automatic Control Ac-19(6):716-723.
Altanzagas, B., Luo, Y., Altansukh, B., Dorjsuren, C., Fang, J., Hu, H. 2019. Allometric equations for estimating the above-ground biomass of five forest tree species in khangai, Mongolia. Forests 10(8). doi:10.3390/f10080661.
Alvarez, E., Duque, A., Saldarriaga, J., Cabrera, K., de las Salas, G., del Valle, I., Lema, A., Moreno, F., Orrego, S., Rodríguez, L. 2012. Tree aboveground biomass allometries for carbon stocks estimation in the natural forests of Colombia. Forest Ecology and Management 267:297-308. https://doi.org/10.1016/j.foreco.2011.12.013.
Aryal, K., Laudary, H.K., Ojha, H.R. 2019. To what extent is Nepal’s community forestry contributing to the sustainable development goals? an institutional interaction perspective. International Journal of Sustainable Development and World Ecology. 27:28-39, DOI:10.1080/13504509.2019.1627681.
Berndes, G., Abt, B., Asikainen, A., Cowie, A., Dale, V., Egnell, G., Lindner, M., Marelli, L., Paré, D., Pingoud, K., Yeh, S. 2016. Forest biomass, carbon neutrality and climate change mitigation. European Forest Institute, p 29.
Bhattarai, K., Convey, D. 2008. Evaluating land use dynamics and forest cover change in Nepal’s Bara district (1973-2003). Human Ecology 36:81-95.
BK, R.B., Sharma, R.P., Bhandari, S.K. 2019. A generalized aboveground biomass model for juvenile individuals of Rhododendron arboreum (SM.) in Nepal. CERNE 25(2):19-130.
Blujdea, V.N.B., Pilli, R., Dutca, I., Ciuvat, L., Abrudan, I.V .2012. Allometric biomass equations for young broadleaved trees in plantations in Romania. Forest Ecology and Management 264:172-184.
Brown, S., Gillespie, A.J.R., Lugo, A.E. 1989. Biomass estimation for tropical forests with applications to forest inventory data. Forest Science 35(4):881-902.
Burnham, K.P., Anderson, D.R. 2002. Model selection and inference: a practical information-theoretic approach. Springer-Verlag, New York, USA.
Chapagain, T., Sharma, R.P., Bhandari, S.K. 2014. Modelling above-ground biomass for three tropical tree species at their juvenile stage. Forest Science and Technology 10(2):51-60.
Chaturvedi, A.N., Khanna, L.S. 2011. Forest mensuration and biometry. Khanna Bandhu, Dehradun.
Chaturvedi, R.K., Raghubanshi, A.S., Singh, J.S. 2012. Biomass estimation of dry tropical woody species at juvenile stage. The Scientific World Journal, doi:10.1100/2012/790219.
Chave, J., Andalo, C., Brown, S., Cairns, M.A., Chambers, J.Q., Eamus, D., Folster, H., Fromard, F., Higuchi, N., Kira, T., Lescure, J-P., Nelson, B.W., Ogawa, H., Puig, H., Riera, B., Yamakura, T. 2005. Tree allometry and improved estimation of carbon stocks and balance in tropical forests. Oecologia 145(1):87-99.
Chave, J., Réjou-Méchain, M., Búrquez, A., Chidumayo, E., Colgan, M.S., Delitti, W.B.C., Duque, A., Eid, T., Fearnside, P.M., Goodman, R.C., Henry, M., Martínez-Yrízar, A., Mugasha, W.A., Muller-Landau, H.C., Mencuccini, M., Nelson, B.W., Ngomanda, A., Nogueira, E.M., Ortiz-Malavassi, E., Pélissier, R., Ploton, P., Ryan, C.M., Saldarriaga, J.G., Vieilledent, G. 2014. Improved allometric models to estimate the aboveground biomass of tropical trees. Global Change Biology 20:3177-3190. doi:10.1111/gcb.12629.
Chen, S., Komiyama, A., Kato, S., Cao, R., Yoshitake, S., Ohtsuka, T. 2017. Stand dynamics and biomass increment in a lucidophyllous forest over a 28-year period in central Japan. Forests 8. doi:10.3390/f8100397.
Chhetri, B.B.K., Lund, J.F., Nielsen, Ø.J. 2012. The public finance potential of community forestry in Nepal. Ecological Econonmics 73(1):113-121.
Chitale, V.S., Behera, M.D. 2012. Can the distribution of sal (Shorea robusta Gaertn. f.) shift in the north-eastern direction in India due to changing climate? Current Science 102(8):1126-1135.
Chung-Wang, X., Ceulemans, R. 2004. Allometric relationships for below-and above-ground biomass of young Scot pines. Forest Ecology and Management 203:177-186.
Clough, B.F., Dixon, P., Dalhaus, O. 1997. Allometric relationships for estimating biomass in multi-stemmed mangrove trees. Australian Journal of Botany 45:1023-1031.
Daba, D.E., Soromessa, T. 2019. Allometric equations for aboveground biomass estimation of Diospyros abyssinica (Hiern) F. white tree species. Ecosystem Health and Sustainability 5(1):86-97. doi:10.1080/20964129.2019.1591169.
De Gier, A. 2003. A new approach to woody biomass assessment in woodlands and shrublands. In: ROY PS (eds.) Geoinformatics for Tropical Ecosystems. Asia Association of Remote Sensing, Dehradun, India, Pp 161-198.
Deng, C., Zhang, S., Lu, Y., Froese, R.E., Ming, A., Li, Q. 2019. Thinning effects on tree height diameter allometry of masson pine (Pinus massoniana Lamb.). Forests doi:10.3390/f10121129.
Devi, L.S., Yadava, P.S. 2009. Above-ground biomass and net primary production of semi-evergreen tropical forest of Manipur, North-Eastern India. Journal of Forestry Research 20:151-155.
DFO Chitwan. 2017. Annual progress report of Chitwan district. District forest office, Chitwan Nepal.
DFRS. 1999. Forest Resources of Nepal. Department of Forest Research and Survey, Ministry of Forest and Soil Conservation, HMGN/ FINIDA, Report, Kathmandu, Nepal, p 33.
DFRS. 2015. State of Nepal’s Forest. Forest Resource Assessment (FRA) Nepal, Department of Forest Research and Survey (DFRS), Kathmandu, Nepal, p 73.
DOF. 2017. Community forestry database. Community forestry division, Department of Forest (DoF), Ministry of forest and soil conservation, Government of Nepal, Kathmanu, Nepal.
Dorado, F.C., Dieguez-Aranda, U., Anta, M.B., Rodriguez, M.S., von Gadow, K. 2006. A generalized height-diameter model including random components for radiata pine plantations in north-western Spain. Forest Ecology and Management 229(1-3):202-213.
Edwards, Jr. T.C., Cutler, D.R., Zimmermann, N.E., Geiser, L., Moisen, G.G. 2006. Effects of sample survey design on the accuracy of classification tree models in species distribution models. Ecological Modelling 199(2):132-141.
Francis JK. 2000. Estimating biomass and carbon content of saplings in Puerto Rican secondary forests. Caribbean Journal of Science 36(3-4):346-350.
Gautam, K.H., Devoe, N.N.. 2006. Ecological and anthropogenic niches of sal (Shorea robusta Gaertn. f.) forest and prospects for multiple-product forest management-a review. Forestry: An International Journal of Forest Research 79(1):81-101. https://doi.org/10.1093/forestry/cpi063.
Huang, S., Titus, S.J., Wiens, D.P. 1992. Comparision of nonlinear height-diameter functions for major Alberta tree species. Canadian Journal of Forest Research 22:1297-1304.
Huy, B., Paudel, K.P., Kralicek, K., Hung, N.D., Khoa, P.V., Phuong, V.T., Temesgen, H. 2016. Allometric equations for estimating tree aboveground biomass in tropical dipterocarp forests of Vietnam. Forest 7(8). https://doi:10.3390/f7080180.
Jackson, J.K. 1994. Manual of afforestation in Nepal. Forest research and survey centre, Kathmandu, Nepal. P 824.
Joshi, K. 2003. Leaf flavonoid patterns and ethnobotany of Shorea robusta Gaertn. (Dipterocarpaceae). Proceedings of International Conference on Women, Science & Technology for Poverty Alleviation (Pp. 101-107). WIST, Kathmandu, Nepal.
Kebede, B., Soromessa, T. 2018. Allometric equations for aboveground biomass estimation of Oleaeuropaea L. subsp. cuspidata in Mana Angetu Forest. Ecosystem Health and Sustainability 4(1):1-12.
Ketterings, Q.M., Coe, R., van Noordwijk, M., Ambagau, Y., Palm, C.A. 2001. Reducing uncertainty in the use of allometric biomass equations for predicting above-ground tree biomass in mixed secondary forests. Forest Ecology and Management 146(1-3):199-209.
Khadka, A., Subedi, T., Ghimire, M., Dhakal, B.P., Parikka, H. 2015. Diameter-height models for the Terai tree species. Banko Jankari 25(1):50-54.
Kibria, S. S., Nahar, T.N., Mia, M.N. 1994. Tree leaves as alternative feed resource for Black Bengal goats under stall-fed conditions. Small Ruminant Research 13:217-222.
Kilpelainen, A., Torssonen, P., Strandman, H., Kellomaki, S., Asikainen, A., Peltola, H. 2014. Net climate impacts of forest biomass production and utilization in managed boreal forests. Global Change Biology Bioenergy 8:307-316.
Klingenberg, C.P. 2016. Size, shape, and form: concepts of allometry in geometric morphometrics. Development genes and evolutions 226:113-137. doi: 10.1007/s00427-016-0539-2.
Kora, A.J. 2019. Leaves as dining plates, food wraps and food packing material: importance of renewable resources in Indian culture. Bulletin of the National Research Centre 43. https://doi.org/10.1186/s42269-019-0231-6.
Land Resources Mapping Project. 1986. Agriculture/ Forestry Report, Land Resources Mapping Project (LRMP). His Majesty Government of Nepal, Kathmandu, Nepal.
Luintel, H., Bluffstone, R.A., Scheller, R.M. 2018. The effects of the Nepal community forestry program on biodiversity conservation and carbon storage. PLoS ONE. 13(6): e0199526.https://doi.org/10.1371/journal.pone.0199526.
Luo, Y., Wang, X., Ouyang, Z., Lu, F., Feng, L., Tao, J. 2020. A review of biomass equations for China’s tree species. Earth System Science Data 12:21-40.
Montès, N., Gauquelin, T., Badri, W., Bertaudiere, V., Zaoui, E.H. 2000. A non-destructive method for estimating above-ground forest biomass in threatened woodlands. Forest Ecology and Management 130:37-46.
Montgomery, D.C., Peck, E.A., Vining, G.G. 2001. Introduction to linear regression analysis. Wiley, New York, USA. P 641.
Mukaka, M.M. 2012. Statistics corner: A guide to appropriate use of correlation coefficient in medical research. Malawi Medical Journal 24(3):69-71.
Nam, V.T., Kuijk, M.V., Anten, N.P.R. 2016. Allometric equations for aboveground and belowground biomass estimations in an evergreen forest in Vietnam. PLoS ONE 11(6). e0156827. doi:10.1371/journal.pone.0156827.
Navar, J. 2009. Allometric equations for tree species and carbon stocks for forests of north-western Mexico. Forest Ecology and Management 257(2):427-434.
Ng'andwe, P., Chungu, D., Yambayamba, A.M., Chilambwe, A. 2019. Modelling the height-diameter relationship of planted Pinus kesiya in Zambia. Forest Ecology and Management 447:1-11.
Nonini, L., Fiala, M. 2019. Estimation of carbon storage of forest biomass for voluntary carbon markets: preliminary results. Journal of Forestry Research. https://doi.org/10.1007/s11676-019-01074-w.
Nuberg, I.K., Shrestha, K.K., Bartlett, A.G. 2019. Pathways to forest wealth in Nepal. Australian Forestry 82:106-120.
Ong, J.E., Gong, W.K., Wong, C.H. 2004. Allometry and partitioning of the mangrove, Rhizophora apiculata. Forest Ecology and Management 188:395-408.
Operational Plan. 2019. Operational plan of Kankali community forest. Kankali Community Forest, Chitwan, Nepal, p 72.
Pastor, J., Aber, J.D., Melillo, J.M. 1984. Biomass prediction using generalized allometric regression for some northeast tree species. Forest Ecology and Management 7:265-274.
Paudel, S., Sah, J.P. 2015. Effects of different management practices on stand composition and species diversity in subtropical forests in Nepal: implications of community participation in biodiversity conservation. Journal of Sustainable Forestry 34:738-760.
Paul, K.I., Roxburgh, S.H., England, J.R., Ritson, P., Hobbs, T., Brooksbank, K., Raison, J., Larmour, J.S., Murphy, S., Norris, J., Neumann, C., Lewis, T., Jonson, J., Carter, J.L., McArthur, G., Barton, C. 2013. Development and testing of allometric equations for estimating above-ground biomass of mixed-species environmental plantings Forest Ecology and Management 310:483-494.
Ravindranath, N.H., Ostwald, M. 2008. Methods for estimating above-ground biomass. In: Ravindranath NH, Ostwald M (eds) Carbon inventory methods: handbook for greenhouse gas inventory, carbon mitigation and round wood production projects. Springer, Dordrecht, Netherlands, Pp 113-114.
R Core Team. 2017. R: A Language and Environment for Statistical Computing.
Sah, S.P. 2000. Management options for sal forests (Shorea robusta Gaertn.) in the Nepal Terai. Selbyana 21:112-117.
Saito-Jensen, M., Rutt, R.L., Chhetri, B.B.K. 2014. Social and environmental tensions-affirmative measures under REDD+ carbon payment initiative. Human Ecology 42(5):683-694.
Segura, M., Kanninen, M. 2005. Allometric models for tree volume and total aboveground biomass in a tropical humid forest in Costa Rica. Biotropica 37(1):2-8.
Sharma, E.R., Pukkala, T. 1990. Volume and biomass prediction equations of forest trees of Nepal. Forest survey and statistical division, Ministry of forest and soil conservation, Kathmandu, Nepal.
Sharma, R.P. 2009. Modelling height diameter relationship for Chir pine trees. Banko Jankari 19(2):3-9.
Sharma, R.P. 2011. Allometric models for total-tree and component-tree biomass of Alnus nepalensis D. Don in Nepal. Indian Forester 137(12):1386-1390.
Sharma, R.P., Bhandari, S.K., BK, R.B. 2017. Allometric bark biomass model for Daphne bholua in mid-hill of Nepal. Mountain Research and Development 37(2):206-215.
Shrestha, D.B., Sharma, R.P., Bhandari, S.K. 2018. Individual tree aboveground biomass for Castanopsis indica in the mid-hills of Nepal. Agroforestry Systems 92(6):1611-1623. doi: 10.1007/s10457-017-0109-2.
Soares, P., Tome, M., Skovsgaard, J.P., Vanclay, J.K. 1995. Evaluating a growth model for forest management using continuous forest inventory data. Forest Ecology and Management 71(3):251-265.
Stainton, J.D.A. 1972. Forests of Nepal. John Murray, London, P 181.
Subedi, M.R., Oli, B.N., Shrestha, S., Chhin, S. 2018. Height-diameter modelling of Cinnamomum tamala grown in natural forest in Mid-Hill of Nepal. International Journal of Forest Research. https://doi.org/10.1155/2018/6583948.
Subedi, M.R., Sharma, R.P. 2012. Allometric biomass models for bark of Cinnamomum tamala in mid-hill of Nepal. Biomass and Bioenergy 47:44-49.
Subedi, T. 2017. Volume models for Sal (Shorea robusta Gaertn.) in far-western Terai of Nepal. Banko Jankari 27(2):3-11.
Tamrakar, P.R. 2000. Biomass and volume tables with species description for community forest management. MoFSC, NARMSAP-TISC, Kathmandu.
Ter-Mikaelian, M.T., Parker, W.C. 2000. Estimating biomass of white spruce seedlings with vertical photo imagery. New Forests 20(2):145-162.
Thapa, T.B., Upadhyaya, C.P., Timilsina, Y.P., Bhandari, S.K., Puri, L. 2013. Predicting total height from diameter using nonlinear models in Pinus roxburghii. Nepal Journal of Science and Technology 14(1):147-152.
Vanclay, J.K., Skovsgaard, J.P. 1997. Evaluating forest growth models. Ecological Modelling 98(1):1-12.
Wagner, R.G., Ter-Mikaelian, M.T. 1999. Comparison of biomass component equations for four species of northern coniferous tree seedlings. Annals of Forest Science 56(3):193-199.
Xing, D., Bergerib, J.A.C., Solarik, K.A., Tomm, B., Macdonald, S.E., Spence, J.R., He, F. 2019. Challenges in estimating forest biomass: use of allometric equations for three boreal tree species. Canadian Journal of Forest Research 49:1613-1622.
Zhao, H., Li, Z., Zhou, G., Qiu, Z., Wu, Z. 2019. Site-Specific Allometric Models for prediction of above and belowground biomass of subtropical forests in Guangzhou, Southern China. Forests 10, 862. doi:10.3390/f10100862.


