Schlüsselbegriffe: Büsche, Lianen, Krautschicht, Bodeneigenschaften, Vielfalt, RDA Analyse, Sekundärwälder, Management, Wiederherstellung
Abstract
Stand density has obvious effects on understory vegetation – an important part of forest ecosystems. Understory biodiversity in tropical rainforests is important for the natural regeneration potential, which is critical for improving the overall function of forest ecosystem. We investigated the effects on plant species diversity (separated in shrubs, interlayer plants and herbs) and soil physical and chemical properties at five levels of stand density (5000, 6500, 8000, 9500, and 11000 trees∙ha-1) in tropical rainforests on the Hainan Island, China. The results showed that soil water content increased with stand density, while organic matter content and both total and available phosphorus content was highest in the moderately dense stand. There was no effect of stand density on the diversity of interlayer plant species (climbing vines). The diversity of the interlayer was consistently greater than herbs, especially at high stand density. Diversity of herbs was lowest in the high-density stand (11000 trees∙ha-1). Species richness and Simpson’s index of dominance of the shrub layer and species richness and its Shannon-Wiener diversity index of the herb layer were both highest at moderate stand density (8000 trees∙ha-1). Species richness and Shannon-Wiener diversity index of interlayer plants peaked at higher stand density (9500 trees∙ha-1), and the Simpson dominance index generally increased with stand density, indicating that climbers are more competitive in denser tropical rainforests. Stand density influenced the diversity and composition of understory species. We found positive correlations for understory plant species diversity with soil water content, organic matter content, total phosphorus, and available phosphorus content. Our results indicate that moderate stand densities of 8000–9500 trees∙ha-1 seem optimal for enhancing understory species diversity, soil fertility, stand stability, and natural regeneration. It could be used as target density for managing secondary tropical lowland rainforests.
Zusammenfassung
Die Bestandesdichte beeinflusst die Bodenvegetation, die ein wichtiger Teil von Walddökosystemen ist. Die Biodiversität der Bodenvegetation in tropischen Regenwäldern ist wichtig für die Naturverjüngung, die wiederum entscheidend ist für die Erhaltung und Verbesserung der Waldfunktionen. Wir untersuchten die Diversität (unterteilt in Sträucher, Lianen/Inter-layer Pflanzen und krautige Vegetation) und die geochemischen Bodeneigenschaften unter fünf verschiedenen Bestandesdichten (5000, 6500, 8000, 9500 und 11000 Bäume pro Hektar) in einem sekundären tropischen Tieflandregenwald auf der Insel Hainan, China. Unsere Ergebnisse zeigten, dass der Bodenwassergehalt mit Bestandesdichte steigt, während der Gehalt an organischer Substanz und der Phosphourgehalt im Boden am höchsten bei mittlerer Bestandesdichte war. Die Bestandesdichte hatte keinen klaren Einfluss auf die Diversität in Lianen, dafür war die Diversität der Krautschicht am größten bei hoher Bestandesdichte (11000 ha-1). Artenanzahl und Simpson Index der Strauchschicht sowie Artenanzahl und Shannon-Wiener Index der Krautschicht waren am höchsten bei mittlerer Bestandesdichte (8000 ha-1). Bei den Lianen waren Artenanzahl und Diversitätsindices am höchsten unter der zweithöchsten Bestandesdichte (9500 ha-1), was vermuten lässt, dass Kletterpflanzen konkurrenzstärker bei mittlerer Bestandesdichte sind. Wir konnten positive Zusammenhänge zwischen Biodiversität und Bodenwassergehalt, Organikanteil, Gesamt Phosphour und verfügbaren Phosphour feststellen. Die Bestandesdichte beeinflusst somit die Diversität und Zusammensetzung der Bodenvegetation auf unterschiedliche Weise. Mittlere Bestandesdichte von 8000-9500 ha-1 erscheint optimal für hohe Biodiversität in der Bodenschicht, Nährstoffversorgung, Bestandesstabilität und natürliche Verjüngung. Dies kann als Zielstammzahl für das Management von sekundären tropischen Tieflandregenwäldern verwendet werden.
1. Introduction
Species diversity is one of the most important characteristics in plant communities, reflecting species richness and the stability and dynamics of a community (Hu, 2016). Diversity indexes are comparable indicators for species richness, productivity, stability and ecological functioning of forest communities at the level of individual plants (Ahmad, 2018). Soil is the basis for plants roots and growth and in consequence their occurrence and development within the community. Fertile soil can improve the uptake of water and nutrients, and thus directly or indirectly affect the growth of plants (Castello, 2011; Wingfield, 2015). On other hand, the growth of plants, their properties and abundance can also cause changes to soil physical and chemical properties, thereby affecting soil stability and plant growth (Pohl, 2009).
Stand density is the number of standing live trees per unit area, which is a useful factor for evaluating forest productivity, as it is linked to tree growth (Luo, 2010). Differences in stand density can result in large variations in the environmental condition of the understory, leading to remarkable difference of growth in all vegetation layers (Lu, 2007). If the stand density is too high, the conditions for the understory is poor, which could restrict growth and lower species diversity. On the other hand, at too low density a few highly competitive species will likely gain superiority, which limits the balanced coexistence of more species and makes it difficult to maintain the level of species diversity. We hypothesize that at moderate density many species have their greatest chance of survival (Zhang, 2019).
Since stand density influences environmental conditions, such as light, heat, and water, it drives changes in the upper canopy as well as understory species richness and diversity (Nguyen, 2014; Bam, 2010). As the forest canopy density increases, the transmittance of the canopy decreases, and the growth and development of undergrowth vegetation are inhibited (Liu, 2014), thus causing changes to species diversity (Wang, 2020). From a forest management perspective, using an appropriate stand density is critical to maintaining species diversity and soil nutrient cycling (Ares, 2010; Xu, 2019).
Tropical rainforests are riche in species diversity and conservation value and among the structurally most complex terrestrial ecosystems, playing an important role in maintaining the global carbon cycle, protecting biodiversity, and regulating climate (Gentry, 1982). Due to environmental change and human disturbance, the area and quality of tropical rainforests have decreased considerably worldwide (Liu, 2018). There are many studies of tropical rain forests, mostly focusing on the impacts of canopy gaps (Li, 2019; Devagiri, 2016), selective logging (Berry, 2008; Brown, 2004), and soil seed banks on species diversity or vegetation types (Olano, 2002). We are not aware of studies focusing on understory species diversity and soil physical and chemical properties of tropical rainforest across stands of different tree densities.
In this study, we investigated the effects of five levels of stand densities on understory species diversity and soil physical and chemical properties, and their correlations for the tropical rainforest on Hainan Island. Determining the optimal stand density could help protect the biodiversity of tropical rainforest and improve forest quality.
2. Material and Methods
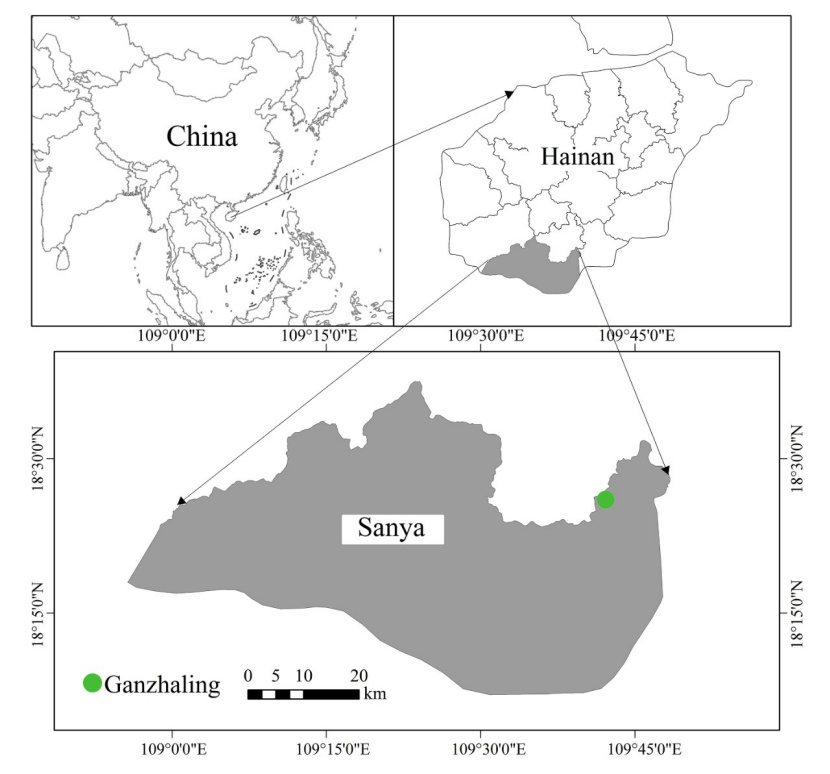
Figure 1: The study area location. / Abbildung 1: Die Lage des Untersuchungsgebiets.
2.1 Study sites
The study area is located in Ganzaling, Hainan Province, China (18°20'–18°21'N, 109°34'–109°42'E; Fig. 1), at elevations ranging from 200 to 350 m. The region has a tropical oceanic monsoon climate, with abundant rainfall and sunshine, and moderate temperatures. The mean annual temperature is 25.4 °C, the solar period is 2563 hours and the annual rainfall is about 2200 mm. The bedrock is granite with mainly acid red soils. The study area is dominated by secondary forests with minimal intervention. Dominant canopy tree species are Hopea reticulate, Acronychia pedunculata, Croton laevigatus, Pterospermum acerifolium, Vatica mangachapoi, and Microcos paniculata. The shrub layer is dominated by Psychotria rubra, Wikstroemia liangii, Glochidion zeylanicum, Memecylon nigrescens, and Licuala fordiana. The dominant interlayer plant are Entada phaseoloides, Rattan, Uvaria calamistrata, Ancistrocladus tectorius, Toxocarpus patens, and Coelospermum kanehirae. The dominant herbs are Aspidistra elatior, Scleria terrestris, and Alpinia oxyphylla. Fig. 2 provides overview of the considered layers. The study area is located in a nature reserve and the stands developed through natural regeneration after large-scale deforestation in the 1980s. Aside of that, here are no other records of human disturbance.
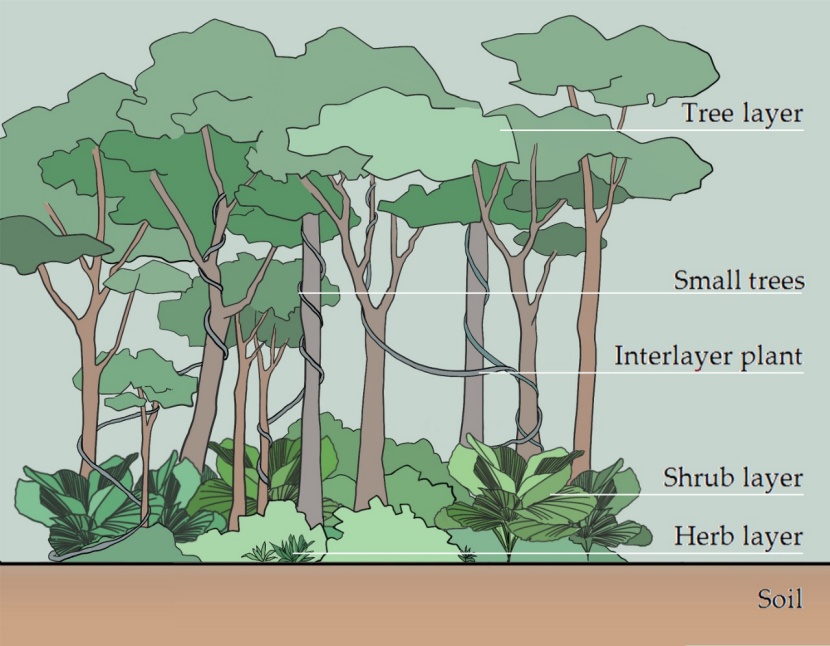
Figure 2: Schematic diagram of different stand layers considered in this study. / Abbildung 2: Übersicht der verschiedenen Bestandsschichten dieser Studie
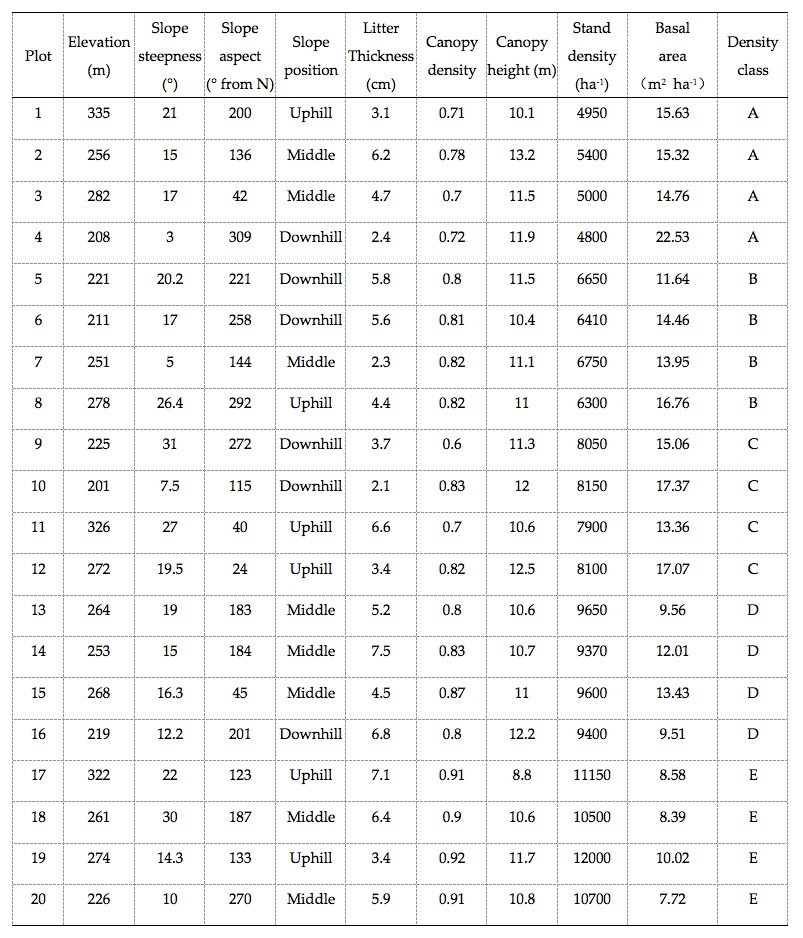
Table 1: Site and stand characteristics of the 20 investigated tropical rainforest stands (plots). / Tabelle 1: Standort- und Bestandseigenschaften der 20 untersuchten Plots in einem tropischen Regenwald.
2.2 Site selection
In April to June 2017, we selected four replicates of 20-m × 20-m stands of five densities (A, 5000 trees∙ha-1; B, 6500 trees∙ha-1; C, 8000 trees∙ha-1; D, 9500 trees∙ha-1 and E, 11 000 trees∙ha-1) (total plot number = 20). In each plot, we measured altitude, steepness, aspect, slope position, litter thickness and stand structure of the canopy (Table 1). The five stand densities (A to E) used in this experiment correspond to the average actual density of sampled plots 1–4, 5–8, 9–12, 13–16, and 17–20, respectively.
2.3 Plant diversity
All trees of each plot with > 1 cm DBH (diameter at breast height at 1.3 m above ground) were sampled, with their individual DBH and species name recorded. Understory vegetation was assessed in three layers: shrubs, herbs, and interlayer plants. Herb species were recorded from five 2-m × 2-m quadrats located at the four corners and one in the center of each plot. Interlayer plants mainly included climbing vines and were measured at diameter 30 cm above ground.
We used α diversity as a measure of community species diversity of each plot, and species importance value (IV) to measure of local dominance, the latter calculated using the formulas reported by Ding and Song (1998) and Fang et al. (2009).
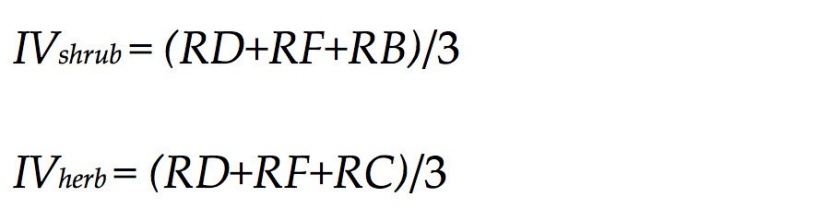
where RD is the relative density, RF is the relative frequency, RB is the relative breast height diameter, and RC is the relative coverage. The IV value was used to calculate species diversity for each plot for shrubs and for herbs. We also calculated species richness (S), Shannon-Wiener (H), Simpson (D), and Pielou’s equitability (Jsw) (Zhang, 2017).
S: expressed as relative species richness (number of species).
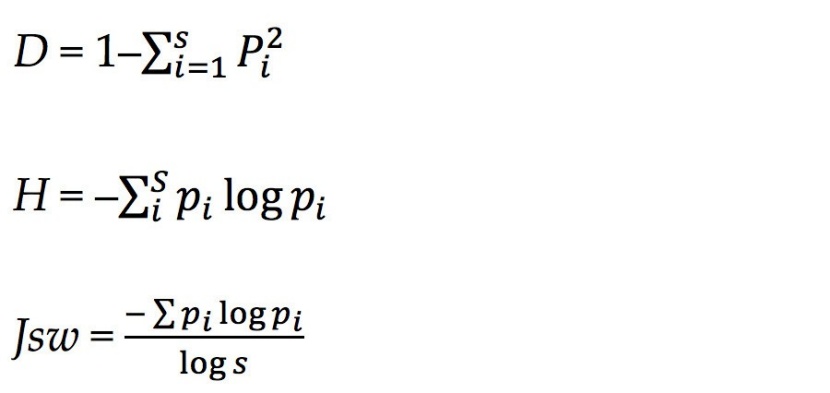
where Pi = ni/n; i = 1, 2, 3, …
2.4 Soil sampling and analysis
The "S" sampling method was adopted to distribute the soil samples and a soil profile was dug at five points per plot was sampled in two layers from two depths (0–20 and 20–40 cm). By using a cutting ring with 5 cm diameter 100 cm3 soil was collected from the center of each layer. The number of soil samples collected per plot was 10 (0-20 cm: 5 and 20-40 cm: 5), with in total of 200 soil samples were collected. We pooled 100 g of soil from each layer per plot into sealed plastic bags to form composite soil samples for analysis of pH, water content, organic matter (OM), total nitrogen (TN), total potassium (TK), available potassium (AK), total phosphorus (TP), and available phosphorus (AP) (State Forestry Bureau, 1999). All soil samples were treated with ball mill after air drying. Soil pH is measured with a pH meter with a water-soil ratio of 2.5:1. Soil water content is measured by the oven drying method. Soil organic matter is measured by K2CrO7-concentrated H2SO4 external heating method. Total nitrogen in the soil is digested with concentrated H2SO4 and measured by a continuous flow analyzer. Total phosphorus in the soil is boiled with concentrated H2SO4-HClO4 and measured by a continuous flow analyzer. Total soil potassium was fused by sodium hydroxide and measured by flame photometric method. Available phosphorus in the soil is extracted with 0.5 mol/L NaHCO3 and measured by a continuous flow analyzer. Soil available potassium was extracted with 1 mol/L NH4OAc and determined by flame photometer.
2.5 Statistical analysis
Differences in species, and soil physical and chemical properties among the five stand densities were analyzed using one-way ANOVA and LSD (least significant difference) tests (significant at P < 0.05). Analyses were carried out in SPSS 11.01 and all presented data are means ± standard deviations.
Soil and environment factors were logarithmic transformed using decadal logarithm, hellinger conversion of understory species diversity index was performed by the decostand function from the ‘vegan’ package, and the residual analysis was completed by the rda function. The interpretation rate of the conversion factor in the rda calculation results was checked by envfit() function. Finally, ggplot2 and ggrepel packages were using for visualization with the R statistical software, version R3.6.1.
3. Results
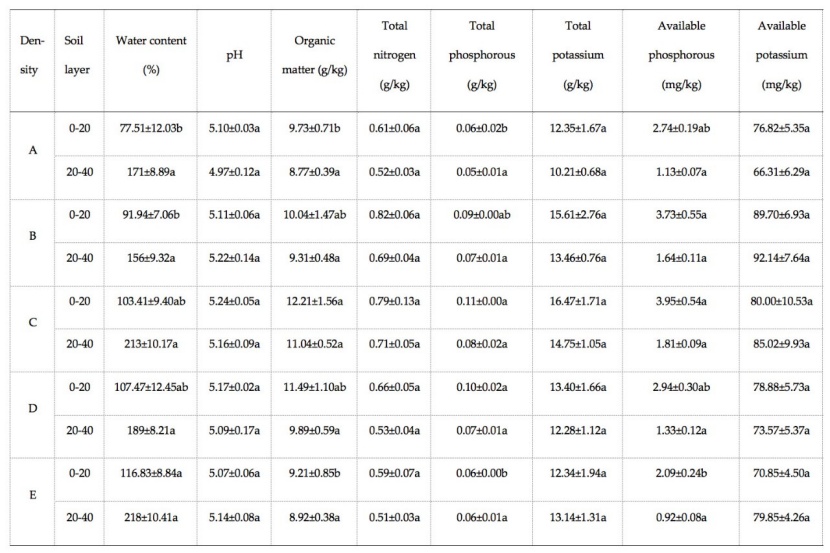
Table 2: Soil physical and chemical properties under different tropical rainforest stand densities. Different letters after the same indexes indicate significant differences between different stand densities in the same soil layer (P-values < 0.05). / Tabelle 2: Bodenphysikalische und bodenchemische Eigenschaften unter unterschiedlich dichten tropischen Regenwaldbeständen. Unterschiedliche Kleinbuchstaben zeigen signifikante Unterschiede zwischen den Bestandsdichten je Bodenschicht an (P < 0.05).
3.1 Soil physical and chemical properties
A comparison for the surface soil (0-20 cm) showed no differences in soil pH, TN, TK, and AK among the stand densities. There were differences for the surface soil in water content, OM, TP, and AP (P-values < 0.05), where water content was largest at highest stand density (E: 11 000 trees∙ha-1), and the remaining variables were greatest in the moderately dense stand (C: 8000 trees∙ha-1) (Table 2). There was no significant difference in physical and chemical properties between the bottom soil (20-40 cm) under different stand densities.
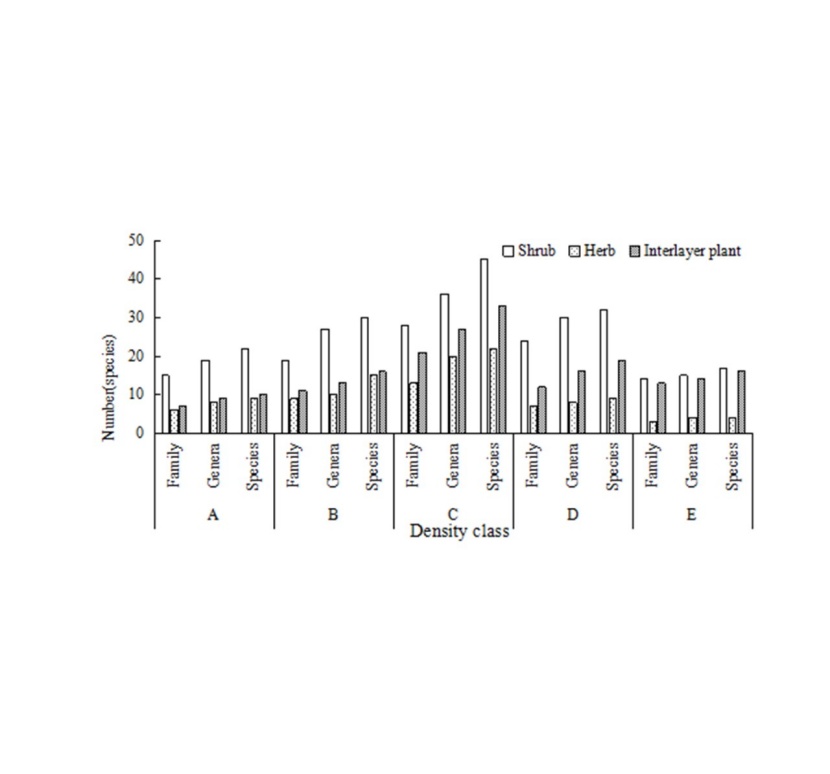
Figure 3: The number of families, genera and species in the understory vegetation under different stand densities in a tropical rainforest. / Abbildung 3: Die Anzahl Familien, Gattungen und Arten in der Unterschicht unter verschiedenen Bestandsdichten in einem tropischen Regenwald.
3.2 Species composition
We recorded in total 179 species from 135 genera and 87 families with 55 species in the shrub layer, 22 species in the herb layer, and 46 species of interlayer plants. Shrub, herb, and interlayer plant species richness was greatest in the moderately dense stand (C: 8000 plants∙ha-1), and lowest at the highest tree density (E: 11000 plants∙ha-1), and we found that interlayer plant species richness was consistently greater than for herbs, especially with increasing stand density (Fig. 3).
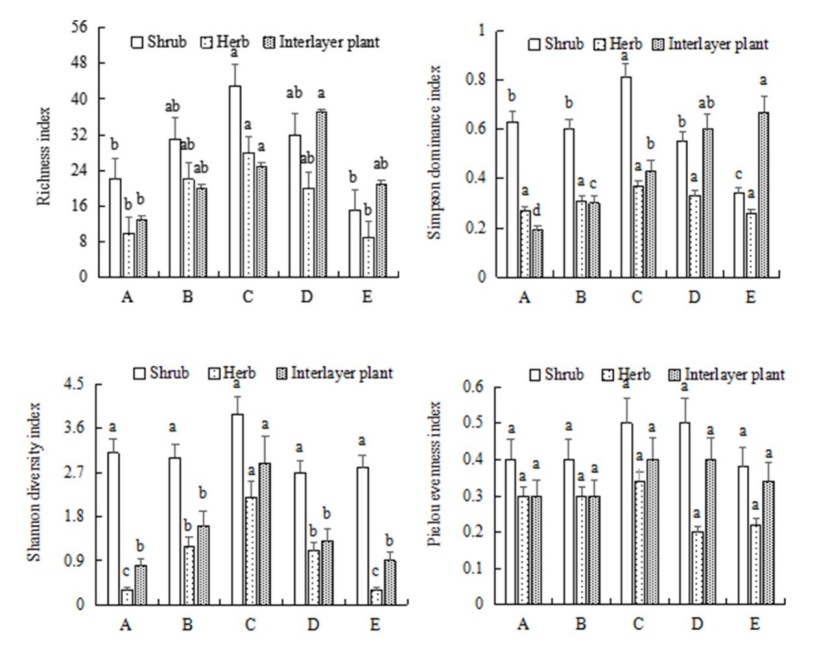
Figure 4: Effects of stand density on selected diversity indexes in a tropical rainforest. Different letters indicate differences at P < 0.05. / Abbildung 4: Auswirkungen der Bestandsdichte auf Artenvielfaltindizes eines tropischen Regenwaldes. Unterschiedliche Buchstaben zeigen signifikante Unterschiede (P < 0.05).
3.3 Species diversity
There were no differences in effect of stand density on either Shannon-Wiener or the Pielou’s equitability indexes for the shrub layer, but there were differences in richness and the Simpson dominance indexes that were greatest in the moderately dense stand (C: 8000 trees∙ha-1). There were no differences in stand density effects on the Simpson dominance and Pielou’s equitability indexes for the herb layer, but the richness and the Shannon-Wiener indexes were greatest at the moderately dense stand (C: 8000 trees∙ha-1). There was no effect of tree density on climber uniformity index, but there were differences in the richness and Shannon-Wiener indexes that were greatest at the higher stand density D (9500 trees∙ha-1), and on the Simpson dominance index that was greatest at the highest density (E: 11000 trees∙ha-1) (Fig. 4).
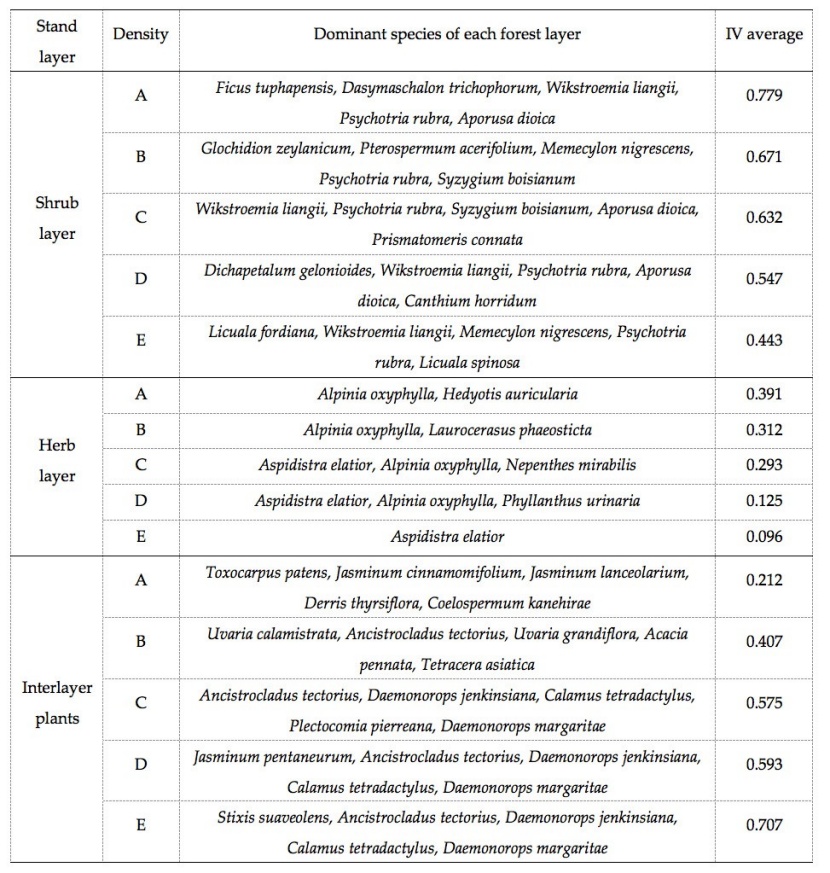
Table 3: Effect of stand density on importance value (IV) of understory vegetation in a tropical rainforest. / Tabelle 3: Einfluss der Bestandsdichte auf den Wichtigkeitswert (IV) in der Bodenvegetation in einem tropischen Regenwald.
3.4 Species importance
Species’ importance value (IV) varied with stand density and we found that the shrub layer was dominated by Wikstroemia liangii, Psychotria rubra, Syzygium boisianum, Aporusa dioica, and Prismatomeris connate; the herb layer was dominated by Aspidistra elatior and Alpinia oxyphylla; and interlayer plants were dominated by Jasminum pentaneurum, Ancistrocladus tectorius, Daemonorops jenkinsiana, Calamus tetradactylus, and Daemonorops margaritae (Table 3).
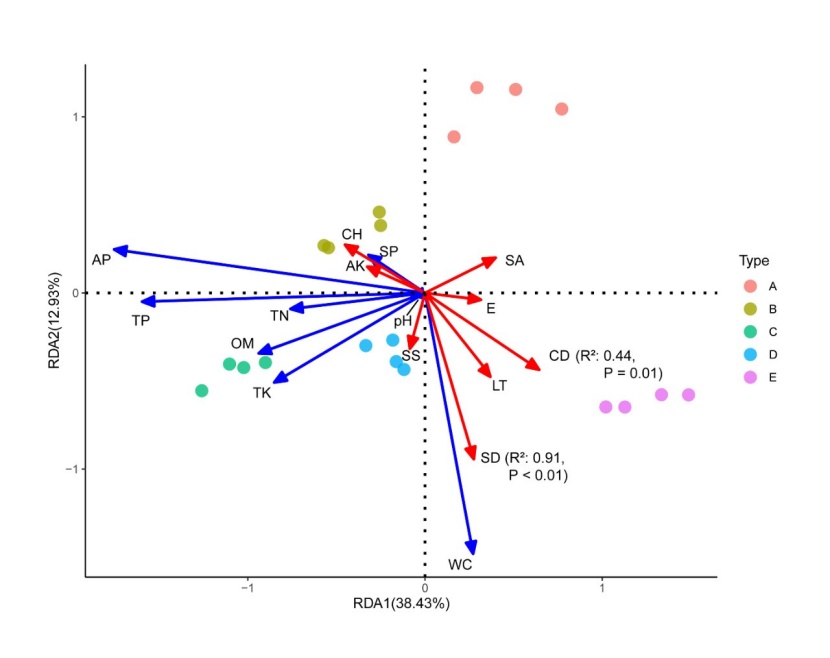
Figure 5: Redundancy analysis of environmental factors for the 20 sample plots. E is elevation, SS slope steepness, SA slope aspect, SP slope position, LT litter thickness, CD canopy density, CH canopy height, SD stand density, WC water content, OM organic matter, TN total nitrogen, TP total phosphorous, TK total potassium, AP available phosphorous, AK available potassium. / Abbildung 5: Redundanzanalyse der Umweltfaktoren für die 20 untersuchten Plots. E ist Seehöhe, SS Hangneigung, SA Hangrichtung, SP Handlage, LT Dicke der Streuschicht, CD Dichte der Oberschicht, CH Kronenhöhe, WC Wassergehalt des Boden, OM Organikanteil, TN Gesamtstickstoff, TP Gesamtphosphor, TP Gesamtkalium, AP Verfügbarer Phosphour, AK Verfügbares Kalium.
3.5 Redundancy analysis
We focused our analysis of the environmental factors on the surface soil (0-20 cm), as the difference of the bottom soil (20-40 cm) were not significant. In our redundancy analysis, the first and second spindles explained variance of 12.93% and 38.43% respectively (Fig. 5). SD (stand density) and CD (canopy density) were the main factor affecting the soil physical and chemical properties. SD, AP, TP and AK were negatively correlated, while WC, PH and TK were positively correlated. All analyzed soil nutrient metrics were correlated. CD was positively correlated with WC and negatively correlated with the soil physical and chemical properties. This may be due to the low light transmittance between gaps and transpiration rate in forests with high stand density, resulting in the increase of soil water content and the decrease of soil nutrient content. At the same time, we found that the LT (litter thickness) had a clear positive correlation with CD and SD and thus density seem to affect the decomposition and release of nutrients in the litter.
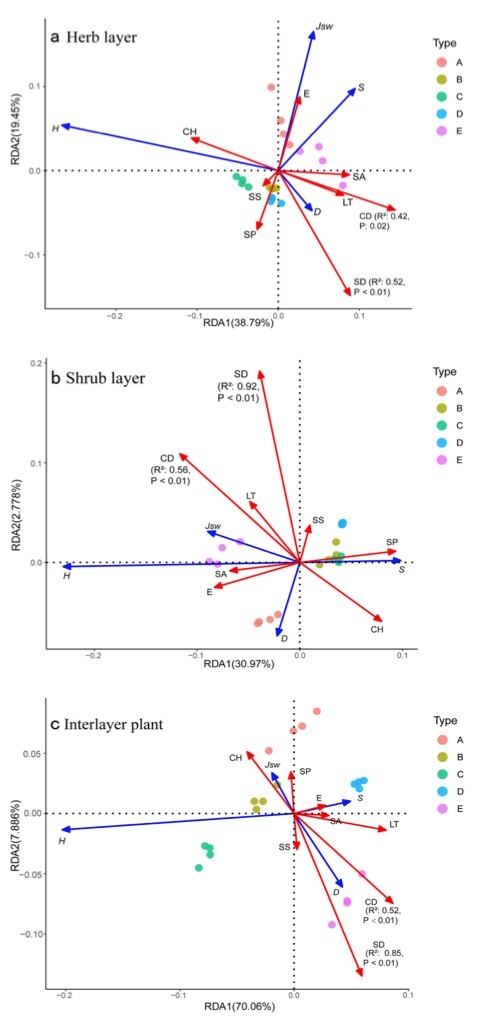
Figure 6: Redundancy analysis of understory species diversity and stand density. / Abbildung 6: Redundanzanalyse von Artenvielfalt in der Unterschicht und Bestandsdichte.
Focusing on the herb layer (Fig. 6a), the first and second spindles explained 38.79% and 19.45% of variance of the species diversity, respectively. Stand density (SD) and Simpson index (D) were positively correlated, and negatively correlated with Shannon-Wiener diversity (H), Pielou’s equitability (Jsw) and species richness (S) and thus SD increases only one diversity index. SD inhibits H and Jsw. CD was also positively correlated with D and negatively correlated with H.
Focusing on the shrub layer (Fig. 6b), the first and second spindles explained 30.97% and 2.778% of variance of species diversity, respectively. SD and CD significantly affected species diversity, as SD was negatively correlated with D and S, and positively correlated with H and Jsw. Thus SD inhibited dominance (D) and richness (S) of shrub layer, while SD promoted diversity (H) and uniformity (Jsw) of shrub layer. Similar to SD, CD was positively correlated with Jsw and H, and negatively correlated with S.
Focusing on interlayer plants (Fig. 6c), the first and second spindles explained 70.06% and 7.886% of the variance variation of species diversity respectively. SD and CD significantly affected species diversity, as we noted a positive correlation between SD and D, and negative correlation between H and Jsw. SD promoted interlayer plant dominance (D), while SD inhibited interlayer plant diversity (H) and uniformity (Jsw). CD was positively correlated with D and S, and negatively correlated with H and Jsw.
4. Discussion
4.1 Effects of stand density on soil physical and chemical properties in tropical rainforests
Stand density is a key driver of forest growth, because it affects airflow, light intensity, root growth, standing litter and decomposition rates and thus influence soil physical and chemical properties (Wei, 2012; Feng, 2018). Light transmittance and humidity under the canopy in turn affect the cycling of nutrients in the soil from litter decomposition (Andrew, 2015). Pristine, structurally diverse tropical rainforest stands have high temperature, humidity and stand density, where tree density drives forest characteristics and dynamics. The formation of habitats within forests leads to differences in soil spatial heterogeneity and physical and chemical properties (Sheng, 2001). In our study, we found that the soil water content increased with the increase of stand density, possibly as a result of a dense canopy and associated low levels of surface transpiration, while content of OM, TP, and AP was greatest at moderate stand density, supporting results of previous studies (Liu, 2010; Peng, 2017).
Forest litter is an important source of soil organic carbon pools and nutrients (Macinnis et al., 2015). Litter decomposition is an important process determining litter accumulation in forest ecosystems and is affected by a range of environmental conditions and the chemical properties of the litter itself (Silver et al., 2001; Sullivan et al., 1999). The positive correlation between LT, SD and CD found in the study suggest that litter may be critical to explain the relationship between stand density and soil properties and litter measurements will be one of our future research directions.
4.2 Effects of stand density on tropical rainforest understory species diversity
Species diversity is an indicator of the complexity of community function and stability (Hao, 2014; Ou, 2014), and stand density is known to influence the growth and composition of understory vegetation by controlling light and moisture interception by trees (Zhou, 2017). With increasing canopy density, there were changes in the light intensity, humidity, soil nutrients and other conditions in the community, resulting in different understory microenvironments, species and distributions of shrub and herbs quantities (Wang, 2008). In our study, stand density affected herb species composition and abundance, both being greatest at the moderate level of stand density, while abundance was the lowest in the high density stand (11000 trees∙ha-1). These results indicate, that the effect of light on herb species survival is likely to be greater than other abiotic factors, such as water, and this drives understory species composition (Alem, 2015). We found that stand density had no effect on species diversity in the shrub layer; this may be beneficial to shrub layer growth in tropical high humidity and temperature environments. Our results that showed diversity of herb and climber species peaked at moderate levels of stand density are supported by previous studies of understory plant diversity indexes (Ding, 2018). By contrast, we found that the Simpson dominance index for climbing vine species increased with stand density, and peaked in the highest density plot, while the Shannon-Wiener diversity index for herbs and climbers in the low-density stand was low. These results indicate that tropical understory species do not thrive under extreme light conditions in the tropics (Kang, 2009). An appropriate forest density can improve the species diversity of a community, and therefore, optimizing forest structure is conducive to the succession of natural forest communities (Fang, 2009).
4.3 Relationships between stand environmental factors, understory species diversity and soil nutrients
Undergrowth vegetation is an important part of forest ecosystems and plays a key role in biodiversity, forest succession, nutrient cycling and maintaining site productivity (Gilliam, 2007). Stand density and canopy density were the main factors that affect understory species diversity and soil nutrients, but they had different effects on plant species diversity in three analyzed stand layers. Stand density promoted the dominance index of herbaceous layer and interlayer plants, but inhibited the diversity index and evenness index. Canopy density promoted the dominance index of herbaceous layer and interlayer plants, and inhibited the diversity index, but the situation of shrub layer was opposite. This may be because herbaceous plants cover the surface of the soil and have shallow roots, which can directly absorb nutrients from the surface of the soil, while shrub layers make use of nutrients from deeper layers (Yu, 2014).
The density of tropical rainforest stands varies and is the result of competition and resource utilization by various species in the forest community (Guo, 2007). The dominance of species change in different successional stages. For instance, when the density is low, ground vegetation, such as wild panax or interlayer plants can obtain more resources and become more dominant. The canopy layer development limits the extent of dominance in undergrowth species, until a new forest gap is created. Therefore, it is critical to understand the effects of stand structure and promote transition of community structure towards "potential natural vegetation" in the tropical rainforest, when protecting undergrowth species diversity is a management goal (Luo, 2013).
4.4 Effect of stand density on management of tropical lowland secondary rainforests
The sub-canopy forest environment is diverse, due to differences in species abundance and canopy density that result in the growth of multiple structural layers (Lu, 2007). In this study, species diversity, abundance and soil water content, organic matter, available phosphorus content were largest in the moderately dense stand (8000–9500 trees∙ha-1) and lowest at high and low stand density. The larger dominance of inter layer climbing plants in the high density stand may have restricted the growth of the canopy layer, since we recorded a relatively low (< 15 m) canopy height considering that about 40 years have passed since disturbance. This study suggests that 8000-9500 trees∙ha-1 can be used as a reference for cultivating and improving quality of tropical lowland secondary rainforests. Currently most of the forests in this region of stand density greater 10,000 trees∙ha-1. Methods such as selective thinning and abandoning irrigation could be used to reach target stand density and improve the community structure of tropical natural forest towards the direction of the natural community.
5. Conclusion
Management of stand density may improve the understory environment, promote litter decomposition, and nutrient cycling, as we found that moderate stand density has positive effects on survival, growth, and regeneration of understory plants. Manipulating stand density may improve sub-canopy light penetration, humidity, and soil physical and chemical properties that benefit understory species abundance, diversity and stand stability and enhance the quality of secondary tropical rainforests. This study provide theoretical guidance and reference values for sustainable management of tropical lowland secondary rainforests.
Acknowledgments
Our deep appreciation goes to Prof. Fan S H, Liu G L, and Peng CH on an in-depth study of tropical rainforest, which generated many of the initial ideas for this paper. Thank you to Li Y B and Huang B for field assistance. We also thank Prof. Fan S H for laboratory facilities, and Liu G L for useful comments on the manuscript and fund support.
Funding Statement
This study was supported by “Twelfth Five-year” National Technology Support Program (2015BAD04B0203).
References
Ahmad B, Wang Y H, Hao J, Liu Y H, Bohnett E, Zhang K B. 2018. Optimizing stand structure for trade-offs between overstory timber production and understory plant diversity: A case-study of a larch plantation in Northwest China. Land Degradation & Development 29(9): 2998-3008.
Alem S, Pavlis J, Urban J. 2015. Pure and mixed plantations of Eucalyptus camaldulensis and Cupressus Lusitanica: their growth interactions and effect on diversity and density of undergrowth woody plants in relation to light. Open Journal of Forestry 4: 375-386.
Andrew S M, Totland O, Moe S R. 2015. Spatial variation in plant species richness and diversity along human disturbance and environmental gradients in a tropical wetland. Wetlands Ecology & Management 23: 395-404.
Ares A, Neill A R, Puettmann K J. 2010. Understory abundance, species diversity and functional attribute response to thinning in coniferous stands. Forest Ecology and Management 260: 1104-1113.
Bam H N, Razafindrabe, He B, Inoue S, Ezaki T, Shaw R. 2010. The role of forest stand density in controlling soil erosion: implications to sediment-related disasters in Japan. Environmental Monitoring and Assessment, 160: 337-354.
Berry N J, Phillips O L, Ong R C, Hamer K C. 2008. Impacts of selective logging on tree diversity across a rainforest landscape: the importance of spatial scale. Landscape Ecology 23: 915-929.
Brown K A, Gurevitch, J. 2004. Long-term impacts of logging on forest diversity in Madagascar. Proceedings of the National Academy of Sciences of the United States of America 101: 6045-6049.
Castello J D, Teale S A. 2011. Forest health: an integrated perspective. Cambridge University Press, New York.
Devagiri G M, Khaple A K, Mohan S, Venkateshamurthy P, Tomar S, Arunkumar A N, Joshi G. 2016. Species diversity, regeneration and dominance as influenced by canopy gaps and their characteristics in tropical evergreen forests of Western Ghats, India. Journal of Forestry Research 27: 799-810.
Ding J W, Zhang Y X, Guo Y D, Yang S H, Ren D, He Z L, Guo J P. 2018. Influences of the Density on Understory Species Composition and Diversity of Larix principis-rupprechtii Natural Forest. Journal of Northwest Forestry University 04: 10-16.
Ding S Y, Song Y C. 1998. Declining causes of Pinus massoniana in the processes of succession of evergreen broadleaved forest. Acta Botanica Sinica 8: 755-760.
Fang J Y, Wang X P, Shen Z H, Tang Z Y, He J S, Yu D, Jiang Y, Wang Z H, Zheng C Y, Zhu J L, Guo Z D. 2009. Methods and protocols for plant community inventory. Biodiversity Science 17(6): 533-548.
Feng Y M, Li Y, Cao X W, Liu J Q, Qi R, Zhao Y, Chen X L. 2018. Characteristics of Stand Structure and Soil Physicochemical Properties of Artificial Young Picea asperata Plantation with Different Densities in Southern Gansu. Scientia Silvae Sinicae 10: 20-30.
Gentry, A H. 1982. Neotropically floristic diversity: Phytogeographical connections between central and south America. Pleistocene climatic fluctuations, or an accident of the Andean progeny. Annals of the Missouri Botanical Garden 69: 557-593.
Gilliam F S. 2007.The ecological significance of the herbaceous layer in temperate forest ecosystems. BioScience 57( 10) : 845-858.
Guo Q F. 2007. The diversity-biomass-productivity relationships in grassland management and restoration. Basic and Applied Ecology 8( 3): 199-208.
Hao J F, Wang D Y, Tang Y B, Li Y, Zhu Y H, Yao X L, Qi J Q. 2014. Effects of human disturbance on species diversity of Pinus massoniana plantation in Jiangyou district. Sichuan province. Ecology and Environmental Sciences 5: 729-735.
Hu J F, Xu M S, Tian W B, Zhou W P, Shi Q R, Zhou L L, Zhao Y T, Zhu D N, Chang J Y, Song Y J, Yan E R. 2016. Community structure for main forests in Mount Putuo, Zhejiang Province. Journal of Zhejiang A&F University 33(5): 768–777.
Kang B, Liu S R, Cai D X, Lu L H. 2009. Effects of Pinus massoniana plantation stand density on understory vegetation and soil properties, Chinese Journal of Applied Ecology 10: 2323-2331.
Li Q, Wang B, Deng Y, Lin L X, Zhaxi D W, Zhang Z M. 2019. Correlation between spatial distribution of forest canopy gaps and plant diversity indices in Xishuangbanna tropical forests. Biodiversity Science 27(03):273-285.
Liu L L, Jin Z X, Li J H. 2010. Plant Species Diversity in Sinocalycanthus chinensis Community and its Correlation with Soil Factors in Dalei Mountain of Zhejiang Province. Bulletin of Botanical Research 01: 57-64.
Liu M H, Li P P, Chen P, Wen B. 2018. Xishuangbanna Tropical Rainforest Soil Seed Bank and Rainforest Conservation. Chinese Wild Plant Resources 37(05): 56-60.
Liu W Z, Guo X L, Zhang S Z, Ma J W, Wang J H. 2014. Diameter class and species diversity of Quercus aliena var. acuteserrata virgin forest in Xiao-longshan forest area. Journal of Northwest A&F University (Natural Science Edition) 42(10): 87-94+102.
Lu S W, Liu F Q, Yu X X, Wang S S, Yang X B, Li C P. 2007. Studys on the Configuration and Function of Different Density of Pines in Rocky Mountain Area of Northern China. Journal of Arid Land Resources and Environment 21( 9): 144-149.
Lu S W, Liu F Q, Yu X X, Wang S S, Yang X B, Li C P. 2007. Studys on the Configuration and Function of Different Density of Pines in Rocky Mountain Area of Northern China. Journal of Arid Land Resources and Environment 09: 144-149.
Luo S M, He D J, Xie Y L, Li S Z, Dong Y P, Wang Q B, Luo J, Lin M H, Zhan, Z R. 2010. Effect of Stand Density on Community Structure and Ecological Effect of Eucalyptus urophylta × E. eamalducensis Plantation. Journal of Tropical and Subtropical Botany 04: 357-363.
Luo Y H, Sun D J, Lin J Y, Guo W F, Lu L H, Wen Y G. 2013. Effect of Close-to-Nature management on the natural regeneration and species diversity in a masson pine plantation. Acta Ecologiea Sinica 33(19): 6154-6162.
Macinnis N C, Schwendenmann L. 2015. Litter fall, carbon and nitrogen cycling in a southern hemisphere conifer forest dominated by kauri (Agathis australis) during drought. Plant Ecology 216(2): 247-262.
Nguyen H, Firn J, David L D, Herbohn J. 2014. Wood density: A tool to find complementary species for the design of mixed species plantations. Forest Ecology and Management 334: 106 -113.
Olano J M, Caballer O I, Laskurain N A, Loidi J, Escudero A. 2002. Seed bank spatial pattern in a temperate secondary forest. Journal of Vegetation Science 13(6): 775-784.
Ou Z Y, Zhu J Y, Peng Y H, He Q F, Pang S L. 2014. Relationship between Plant Diversity and Environmental Factors of Excentrodendron hsienmu Community in Karst Mountains in Pinguo County, Guangxi. Bulletin of Botanical Research 2:204-211.
Peng C, Fan S H, Liu G L, Xu R J, Hu, X, Su H R. 2017. Distribution and impact factors of rattan in lowland secondary rain forest in Hainan Island, China. Chinese Journal of Ecology 10: 2725-2733.
Pohl M, Alig D, Körner C, Rixen C. 2009. Higher plant diversity enhances soil stability in disturbed alpine ecosystems. Plant and Soil 324: 91-102.
Sheng W T. 2001. A Long-term Study on Development and Succession of Undergrowth Vegetations in Chinese Fir (Cunninghamia lanceolata) Plantations with Different Density. Forest Research 05: 463-471.
Silver W L, Miya R K. 2001. Global patterns in root decomposition: comparisons of climate and litter quality effects. Oecologia 129(3): 407-419.
State Forestry Bureau. 1999. Forest soil analysis method; LY/T 1210-1275-1999, Beijing, China, 1-108.
Statistical package for Social Sciences. Version 11.0.1.
Sullivan N H, Bowden W B, McDowell W H. 1999. Short-term disappearance of foliar litter in three species before and after a hurricane. Biotropica 31(3): 382-393.
Wang S S, Yu X X, Luo Y Y, Zhao G L, Yang J, Hai L. 2008. Effects of reforestation on woody plant biodiversity of forest vegetation in Badaling, Beijing. Journal of Beijing Forestry University 30(S2): 155-159.
Wang Y, Jiang X B, Wu D Z. 2020. Species Diversity Characteristics of a Natural Pinus taiwanensis Community with Different Diameter Classes and Forest Densities. Journal of Resources and Ecology 11(04):349-357.
Wei Q, Ling L, Chai C S, Zhang G Z, Yan P B, Tao J X, Xue R. 2012. Soil physical and chemical properties in forest succession process in Xinglong Mountain of Gansu. Acta Ecologica Sinica 15: 4700-4713.
Wingfield M J, Brockerhoff E G, Wingfiekd, B D. 2015. Plant forest health: the need for a global strategy. Science 349(6250): 832-836.
Xu X L, Sun Y J, Zhou H, Zhang P, Hu Y, Wang X J. 2019. Effects of thinning intensity on understory growth and soil properties in Chinese fir Plantation. Scientia Silvae Sinicae 55(3): 1-12.
Yu Y, Zou L, Sun T T, Guo J, Zhang G Q, Tang Q M. 2014. Relationship between vegetation diversity and soil functional diversity in native pine forests. Pratacultural Science 31(7): 1241-1247.
Z D. 2009. Methods and protocols for plant community inventory. Biodiversity Science 06: 533-548.
Zhang H, Zhou G M, Bai S B, Wang Y X, Yo Y J, Zhu T T, Zhang H F. 2017. Effects of target tree tending on community structure and diversity in subtropical natural secondary shrubs. Chinese Journal of Applied Ecology 05:1414-1420.
Zhang L H, Qi J Q, Li T T, Yu S Y, Zhang X Y, Zhang R, Hao J F. 2019. Effects of stand density on understory plant diversity and biomass in a Pinus massoniana plantation in Wenfeng Mountain, Xinjin County. Acta Ecologica Sinica 39( 15): 5709-5717.
Zhou S P, Liang K N, Du J, Li B J, Zhou Z Z, Huang G H. 2017. Research on Understory Vegetation and Soil Physical-chemical Properties of Teak Plantation with Difference Stand Densities. Bulletin of Botanical Research 02: 200-210.


