Schlüsselbegriffe: Kohlenstoffdynamik, Effizienzanalyse, unerwünschte Folgen, CO2-Emissionen, Hyrkanischer Wald, Fagus orientalis
Abstract
The aim of this paper is to measure the relative performance of forest management units considering economics and carbon dynamic in Caspian forests of Iran. Data Envelopment Analysis (DEA) as a well-known and robust technique for measuring the relative efficiency of Decision Making Units (DMUs) was used for measuring the efficiencies of 33 forest management units or DMUs. The relative efficiency of DMUs was calculated using global technical efficiency (CCR) model using three scenarios for undesirable output, like CO2 emission due to forest management activities. The main challenges that are considered in the modelling of the undesirable outputs were to consider the undesirable outputs in the modelling process along with the desirable outputs. The three scenarios were to ignore the undesirable output (scenario 1), to treat the undesirable outputs as inputs (scenario 2) and to apply a monotone decreasing transformation to the undesirable outputs and then to use the adapted variables as outputs (scenario 3). Results of input-oriented CCR model based on scenarios 1 and 2 showed that, 10 and 13 DMUs became efficient, respectively. Results of input-oriented and output-oriented CCR models based on scenario 3 indicated that 11 DMUs became efficient. By including the undesirable output in efficiency analysis of forest management units, this study shows how we can expand a new path in efficiency analysis of forest management units and provide important input to the forest organizations supervising the forestry sector.
Zusammenfassung
Ziel dieser Studie ist es, die relative Performance von forstlichen Bewirtschaftungseinheiten hinsichtlich wirtschaftlicher Aspekte und der Kohlenstoffdynamik zu untersuchen. Data Envelopment Analyse (DEA) ist eine weit verbreitete und robuste Methode um die relative Effizienz von Entscheidungseinheiten (DMU) und wurde hier verwendet, um die Effizienz von 33 forstlichen Bewirtschaftungseinheiten oder DMUs zu untersuchen. Die relative Effizienz der DMUs wurde mit einem global technical efficiency model (CCR) mittels drei Szenarien der unerwünschten Folgen berechnet, wie CO2-Emissionen der Bewirtschaftungsmassnahmen. Eine wichtige Herausforderung in der Modellierung war es, die unerwünschten Folgen gemeinsam mit den erwünschten Folgen zu berücksichtigen. Die drei Szenarien sind die unerwünschten Folgen zu ignorieren (Szenario 1), die unerwünschten Folgen als Input zu verwenden (Szenario 2) und eine monoton abnehmende Transformation der unerwünschten Folgen zu verwenden und dann die so modifizierten Variablen als Input zu verwenden (Szenario 3). Die Ergebnisse der Input-orientierten CCR-Modelle unter Verwendung von Szenario 1 und 2 zeigten, dass 10 bzw. 13 DMUs effizient wurden. Hingegen waren bei einem Input- und Output-orientierten CCR-Modell (Szenario 3) 11 DMUs effizient. Wenn wir die unerwünschten Folgen in der Effizienzanalyse von forstlichen Bewirtschaftungseinheiten berücksichtigen, können wir neue Optimierungspotentiale aufzeigen und damit Forstbetriebe bei der Aufsicht des Waldbewirtschaftung unterstützen.
Introduction
The forests of Iran represent 7.5 % of the total size of the country. Iranian Caspian or Hyrcanian forests are located on the south coast of the Caspian Sea and the northern slopes of the Alborz Mountain range from sea level to 2,800 m. These forests grow in a strip 800 km in length and 20-70 km wide. These are the most valuable forests in Iran. Industrial harvesting occurs only in the Caspian forest. Because of the severe climatic conditions and forest degradation, forests in other regions are not exploited for industrial wood production. Forest industries in Iran produce sawnwood and wood-based panels as well as pulp and paper from hardwood species. Moderate volumes of forest products, mainly paper, are imported. Modest quantities of wood are burned as fuel (Mohammadi Limaei, 2010).
Efficiency measurement has received a great attention and has become increasingly important in many areas and organizations. Efficiency evaluation of a DMU is an important task for purpose of control, planning and benchmarking. Data envelopment analysis (DEA) developed by Charnes et al. (1978). DEA is a linear programming optimization to calculate the efficiency of multiple DMUs with multiple inputs and outputs. DEA is a nonparametric approach in operations research for estimation of production frontiers and used to measure productive efficiency of DMUs (Charnes et al., 1978). DEA is a technique that widely applied to measure the relative efficiency of a set of production systems, or DMUs, which apply the same inputs to produce the same outputs. This method identifies DMUs with weak performance and thus highlights sources of inefficiency (Cardillo and Fortuna, 2000).
Traditional forest planning sought achievement of economic goals such as maximizing net present value through timber harvest or enhancing environmental protection. Less attention was given to multipurpose goals because, in many cases, these goals conflicted with each other (Mohammadi Limaei et al., 2014). The efficiency measurement of forest management plans can be very complicated with considering multiple goals in forest management such as economic, ecological and social objectives. In the last few decades, forest management has been focussed on multifunction usage and general benefits of forests. Owing to the multiple benefits and advantages offered by the forest as well as the non-market nature of part of these outputs, measuring the efficiency in forestry is highly demanding (Sporcic et al., 2009). Estimation of the accumulated biomass in the forest ecosystem is important for assessing the productivity and sustainability of the forest. It also gives us an idea of the potential amount of carbon that is emitted as CO2 when forests are harvested or burned (Lu, 2006). Nowadays, the increasing environmental issues of forest management and logging operation is important due to greenhouse gas emissions and climate change issues. Therefore, it is necessary to assess the economic and environmental efficiency of forest management activities and forest industries.
There are several studies dealt with efficiency analysis in forestry and forest industries such as Kao and Yang, 1991; Bogetoft et al. 2003; Hailu and Veeman, 2003; Salehirad and Sowlati, 2007; Helvoigt and Adams, 2008; Mohammadi Limaei, 2013; Wu and Zhou, 2014; Zadmirzaei et al., 2015, 2016, 2017 and 2019.
In these studies evaluating the efficiency of forestry and forest industries, there was less attention to the environmental issues such CO2 emission during logging operation as well as environmentally services such as carbon sequestration. Ignoring undesirable output may give high score of efficiency of some DMUs. Hence, the aim of this research is to determine the efficiency of some forest management plans in Iranian Caspian forests with considering CO2 emission during the logging operation as an undesirable output. In addition, carbon sequestration will be considered as a desirable output.
Material and methods
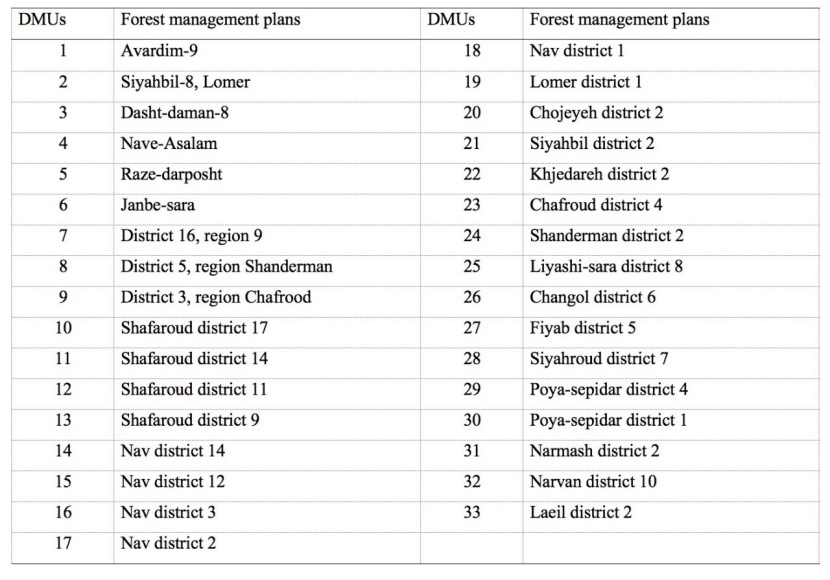
Table 1: Names of forest management plans. / Tabelle 1: Namen der forstlichen Bewirtschaftungseinheiten.
Study area
The needed data was collected from 33 forest management plans in Shafaroud forest, north of Iran (Fig. 1). The names of forest management plans are shown in Table 1. The dominant tree species in this region is beech (Fagus orientalis). Other frequent tree species are hornbeam (Carpinus betulus), Persian maple (Acer velutinum), Cappadocian maple (Acer cappadocicum), largeleaf linden (Tilia platyphyllos), smooth leaved elm (Ulmus minor), wych elm (Ulmus glabra) and sweet cherry (Cerasus avium) (Sagheb-Talebi et al. 2013).
Data collection
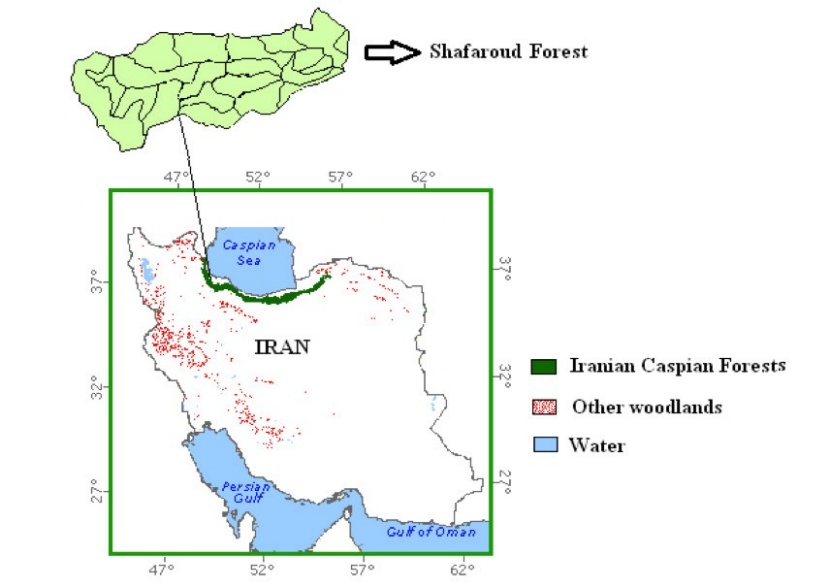
Figure 1: Iranian forests map (FAO, 1999, Global Forest Cover map) and the study area (Shafaroud forest). / Abbildung 1: Karte der Iranischen Wälder (FAO, 1999, Global Forest Cover map) und des Untersuchungsgebiets (Shafaroud Wald).
Booklets of Forest Management Plans were used to collect the data such as volume per hectare (stock), fixed cost, variable cost and harvesting revenue (Guilan Department of Natural Resources, 2018). It should be noted that the length of forest management plans period were 10 years. Hence, the average data of a ten-year period were considered. The monetary values were deflated using consumer price index (CPI) of Iran based on the base year of 2016 (Central Bank of Iran, 2018).
The following data were considered:
Stock 1: The volume before starting forest management plan (before harvesting) (year zero).
Stock 2: The volume after forest management plan (after harvesting) (10 years later).
Sequestered carbon in stock 1: The amount of carbon sequestered in stem wood volume before harvesting using the methodology of Mohammadi et al. (2017).
Sequestered carbon in stock 2: The amount of carbon sequestered in stem wood volume after harvesting.
Costs and revenues: Real fixed costs, variable costs and real harvested revenue (Iranian million Rials).
CO2 emission: Since there was not any data about CO2 emission in forest logging using chainsaw in Iranian Caspian forests, I used the amount of CO2 emission during the logging operation using chainsaw in forest management plans according to Dias (2007).
Sequestered carbon in wood products: The sequestered carbon in harvested timber in ton carbon per hectare was determined according to Mohammadi et al. (2017).
Forest protection task: Some questionnaires were distributed between the experts of Natural Resources office at Guilan province in Iran for rating scale of forest protection activities (i.e. regeneration) during the implementation of each forest management plan (the score in questionnaires was from 1 to 5 based on Likert scale) (Zadmirzaei et al., 2019).
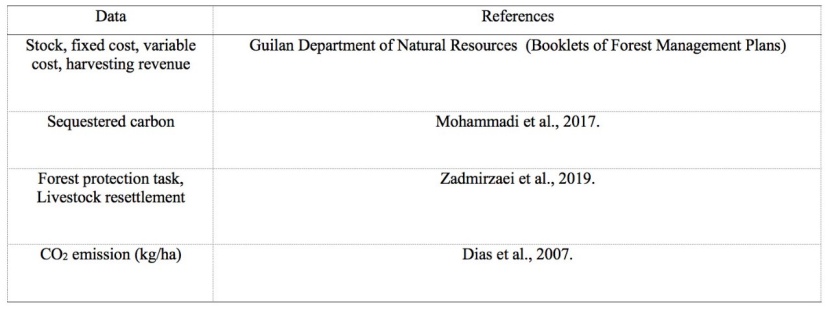
Table 2: A summary of sources used for data collection. / Tabelle 2: Zusammenfassung der Datenquellen.
Livestock resettlement: Livestock resettlement is the withdrawal of animal husbandry units out of the forest and is one of the major socioeconomics problem in Iranian forests. This score was obtained using questionnaires based on Likert approach (Zadmirzaei et al., 2019).
A summary of sources in data collection and numerical data are shown in Table 2 and 3, respectively.
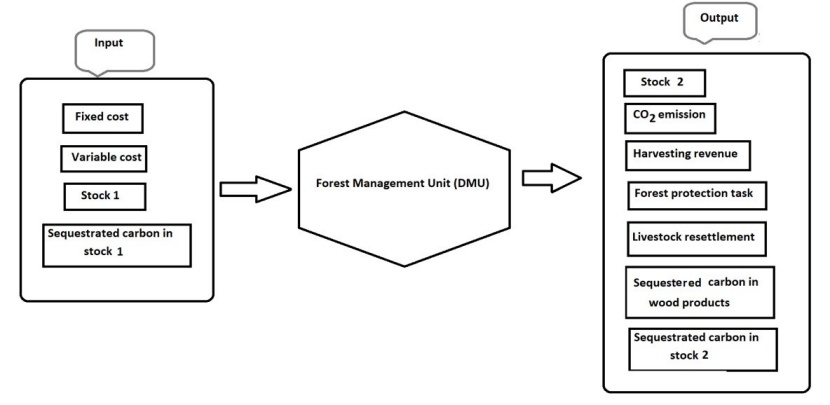
Figure 2: Production system of the forest management units consisting four input and seven output. / Abbildung 2: Produktionssystem der forstlichen Bewirtschafungseinheiten mit vier Inputs und sieben Outputs.
In this research, four inputs (stock 1, sequestered carbon in stock 1, fixed costs, variable costs) and seven outputs (harvesting revenue, stock 2, sequestered carbon in stock 2, forest protection task, livestock resettlement task, CO2 emission) were considered (Fig. 2). At least 33 forest management plans should be selected using the following rule of thumb in DEA approach:
n = 3 (m + s)
Where n is number of DMUs, m is number of inputs, and s is number of outputs. Afterwards, it is assumed that this (or other) degrees of freedom conditions are satisfied and no further consideration are needed in this regard (Cooper et al. 2011).
Estimation of sequestered carbon
Mohammadi et al. (2017) estimated the amount of sequestered carbon in stem wood using Eq. (1). For further information about the carbon model and growth function see Mohammadi et al. (2017, 2018).

Due to lack of data about logging residues and wood processing residues, the amount of sequestered carbon in wood products also estimated using Eq. (1).
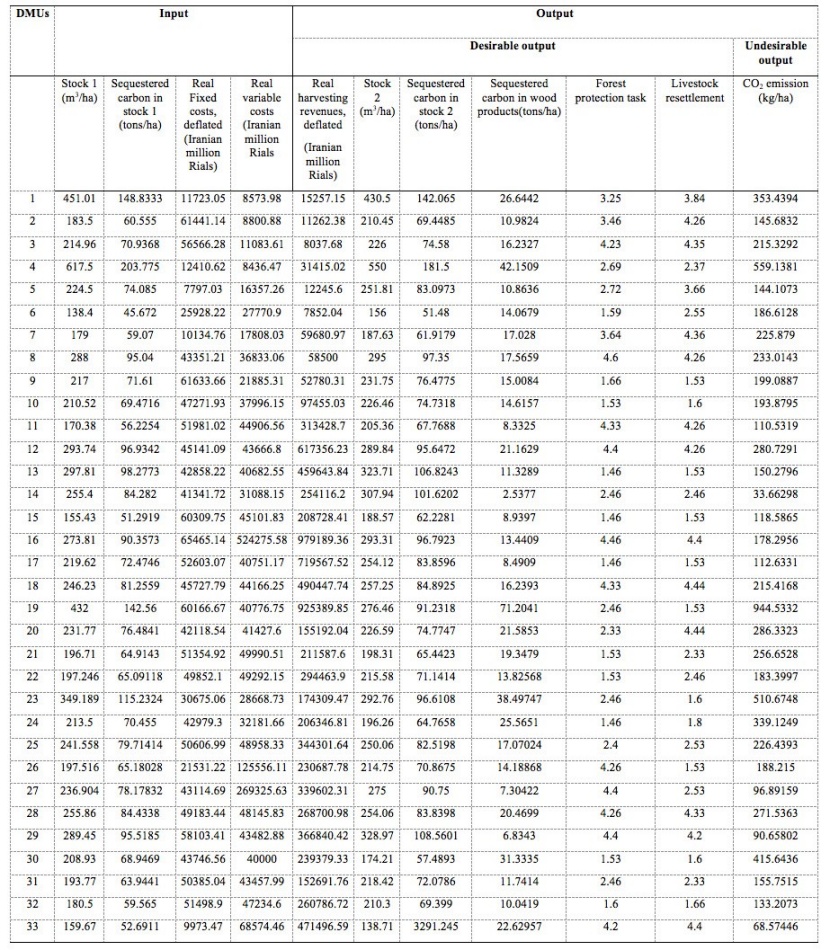
Table 3: Input and output of 33 DMUs (forest management units) from Shafaroud forest. / Tabelle 3: Input und Output der 33 DMUs (forstlichen Bewirtschaftungseinheiten) im Shafaroud Wald.
The average wood density is needed for Eq. (1). Average wood density of the species in the study area was taken from the literature (Parsa Pajouh, 1995). The wood density of hornbeam, beech and the other species (maple, ash, elm, etc.) are 0.670, 0.621 and 0.700, respectively. Therefore, their average wood density is 0.664. The wood volume data (stock 1, stock 2 and wood products) was collected from Booklets of Forest Management Plans (Guilan Department of Natural Resources, 2018) and used in Eq. 1 (Table 3). Stock 2 is larger than stock 1 in some DMUs in Table 3, since the amount of harvesting in some DMUs were lower than the increment during the forest management period of 10 years.
Estimation of CO2 emission
There was no suitable data available about CO2 emission by forest logging in Iranian Caspian forests. Therefore, the amount of CO2 emissions was estimated during the logging operation using chainsaw in different forest management plans. According to Dias et al. (2007) the average CO2 emission in operation curried out during the logging by using chainsaw including cutting and processing (felling, limbing, bucking, debarking), extraction and log loading onto trucks in Portugal for eucalypt and maritime pine stands was 4377.5 g CO2/m3. Hence, the amount of wood production in different forest management units was multiplied to 4377.5 and the amount of carbon emission was estimated. It should be noted that Caspian forests are temperate broadleaf and mixed forests, and are quite different from eucalypt and pine stands in Portugal, but the similarity of forest logging using chainsaw in both regions was the main reason to use the results of Dias et al. (2007) as a reference for the estimation of CO2 emission in this study.
Data analysis
Data Envelopment Analysis (DEA)
DEA, which was introduced by Charnes et al. (1978), is a well-known and non-parametric method for measuring the relative efficiency of DMUs with multiple inputs and outputs. The basic DEA model for measuring the efficiency of DMU k is given below:
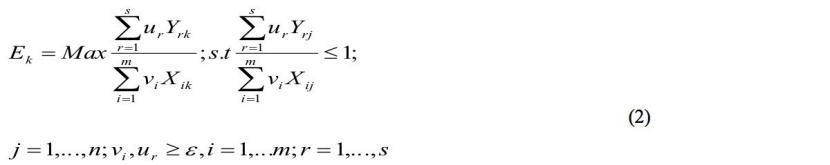
Ek = the relative efficiency of DMU k. vi = the weight given to input i. ur = the weight given to output r. The kth DMU utilizes m inputs Xik = 1, m to produce s outputs Yrk, r = 1,. . . , s. If Ek = 1, DMU k is efficient and if Ek < 1, DMU k is inefficient.
CCR Model
DEA model introduced by Charnes, Cooper and Rhodes in 1978 is called CCR model. DEA is an effective technique for measuring the relative efficiency of a set of DMUs using the same inputs to produce the same outputs. Suppose there are n DMUs. The kth DMU uses m inputs Xik = 1, m to produce s outputs Yrk, r = 1,. . . , s. Its efficiency Ek is calculated through the following CCR model (Charnes et al., 1978):
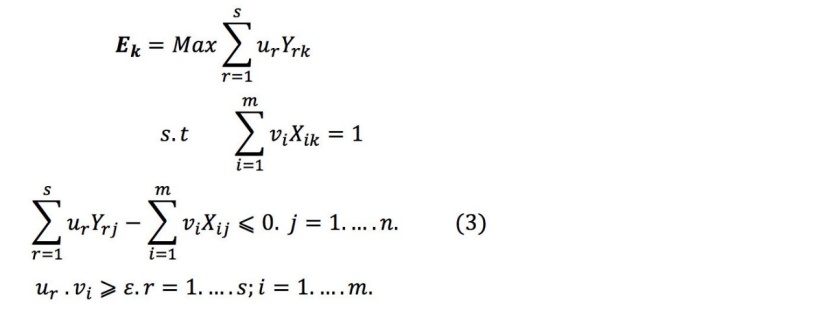
Xij = amount of input i used by unit j. Yij = amount of output r produced by unit j. vi = the weight given to input i. ur = the weight given to output r. Where ur and vi are the most favorable multipliers to be applied to rth output and ith input for DMUk in calculating its efficiency Ek and e is a small non- Archimedean quantity (Charnes et al., 1978; Charnes and Cooper, 1984) which prohibits any input/output factor to be ignored. CCR model is a constant return to scale model. The model run n times to determine the relative efficiency scores of all the DMUs. Each DMU selects a set of input weights vi and output weights ur that maximize its efficiency score. A DMU is efficient, if it obtains the maximum score of 1, otherwise it is not efficient.
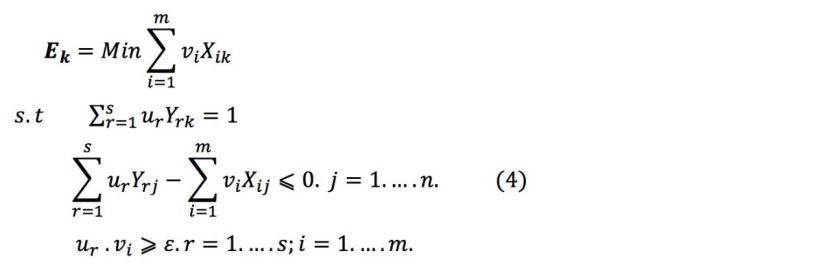
Eq. (3) is called an input-oriented model that minimize the inputs for a desired level of output to be achieved and it focuses on minimizing the level of inputs with an assumption of fixed level of outputs. In contrast, an output-oriented DEA model maximize the outputs although input kept at a constant level. Hence, the difference between output-oriented CCR model with input-oriented one is that instead of maximizing output, input is minimized and the output is assumed equal 1 for the same DMU under investigation. The other constraints remain unchanged as below:
Undesirable output model
There are some outputs, that are undesirable such as CO2 emission during the production process or tax payments in financial firms or interest payments to the depositors in a bank. The main challenges that are considered in the modeling of the undesirable outputs is to consider the undesirable outputs in the modeling process along with the desirable outputs. In addition, we need to reduce the undesirable outputs while the desirable outputs be increased in order to increase the efficiency of DMU.
Seiford and Zhu (2002) defined five possibilities to deal with undesirable outputs in the DEA-BCC framework:
- "The first possibility is just simply to ignore the undesirable outputs.
- The second is to treat the undesirable outputs in the non-linear DEA model.
- The third is to treat the undesirable ones as outputs and to adjust the distance measurement in order to restrict the expansion of the undesirable outputs (see the weak disposability model in Färe et al., 1989).
- The fourth is to treat the undesirable outputs as inputs. However, this does not reflect the true production process.
- The fifth is to apply a monotone decreasing transformation (e.g. 1 = yb ) to the undesirable outputs and then to use the adapted variables as outputs. The use of linear transformation preserves the convexity relations and it is a good choice for a DEA model”.
In this research, the following three scenarios considered to treat with undesirable output of CO2 emission:
Scenario1 = Ignore the undesirable output
Scenario 2 = Treat the undesirable outputs as inputs
Scenario 3 = Apply a monotone decreasing transformation to the undesirable outputs and then to use the adapted variables as outputs.
LINGO software was used for analysis of efficiency score in DEA models under three above-mentioned scenarios.
Sensitivity analysis of DEA models
Sensitivity analysis in DEA studies is used to investigate how sensitive the solution values and efficiency scores of the DMUs are to the numerical input and output data. A developed analytical method for studying the sensitivity of DEA results to variations in the data is explained by Cooper et al. (2011). The results of sensitivity analysis can be a guideline for inefficient DMUs in order to be able to improve their efficiency scores and reach to the efficiency frontier or efficient DMUs. It is not possible to find which of the input parameters has the strongest effect on the results of efficiency score because the assumption is that all input and output have the same weight in DEA analysis. DEA uses linear programming approach to measure the relative efficiency of DMUs with multiple inputs and outputs whereas each variable (input and output) considered as a decision variables. The aim is to maximize output or minimize input (based on the objective function). However, if we give weight for each variable based on a qualitative method such as Analytical Hierarchy Process (AHP), then we can priorities the input and output variables in order to investigate which variable is more important and has strongest effect on the results of DEA analysis.
An increase of any output or a decrease of any input can not worsen the efficiency of DMUs. Therefore we restrict our attention to decrease in outputs and increase in inputs for DMUS (Seiford and Zhu, 1998). In order to simultaneously considering the data changes for the other DMUs, they suppose increased output and decreased input for all other DMUs. Hence, the suggested approach by Seiford and Zhu (1998) was used for sensitivity analysis in this research whereas 10 % output increased and 10 % input reduced to analyse the changes of data on efficiency scores.
T-test
The t-test using Excel software performed to determine if the means of efficiency scores are significantly different from each other.
Analysis of Variance (ANOVA)
One way Analysis of Variance (ANOVA) using Excel software performed to investigate, if there is any significance among the means of efficiency scores of various DMUs (33 forest management plans) in three scenarios.
Results
DEA analysis
Scenario 1 - Ignoring the undesirable output.
Here the input-oriented CCR model (Eq. 3) was used to determine the efficiency of forest management, ignoring the CO2 emission. According to the results (Table 4), 10 DMUs are efficient as their efficiency score is 1 and the others are inefficient with efficiency score lower than 1.
Scenario 2 - Treat the undesirable outputs as input
Here the input-oriented CCR model (Eq. 3) was used to determine the efficiency of forest management considering undesirable outputs (CO2 emission) as an input. According to the results (Table 4), 13 DMUs are efficient and the others are inefficient.
There are some differences between the results of scenario 2 and scenario 1 as in scenario 2 four more DMUs are efficient (13, 14, 19 and 29).
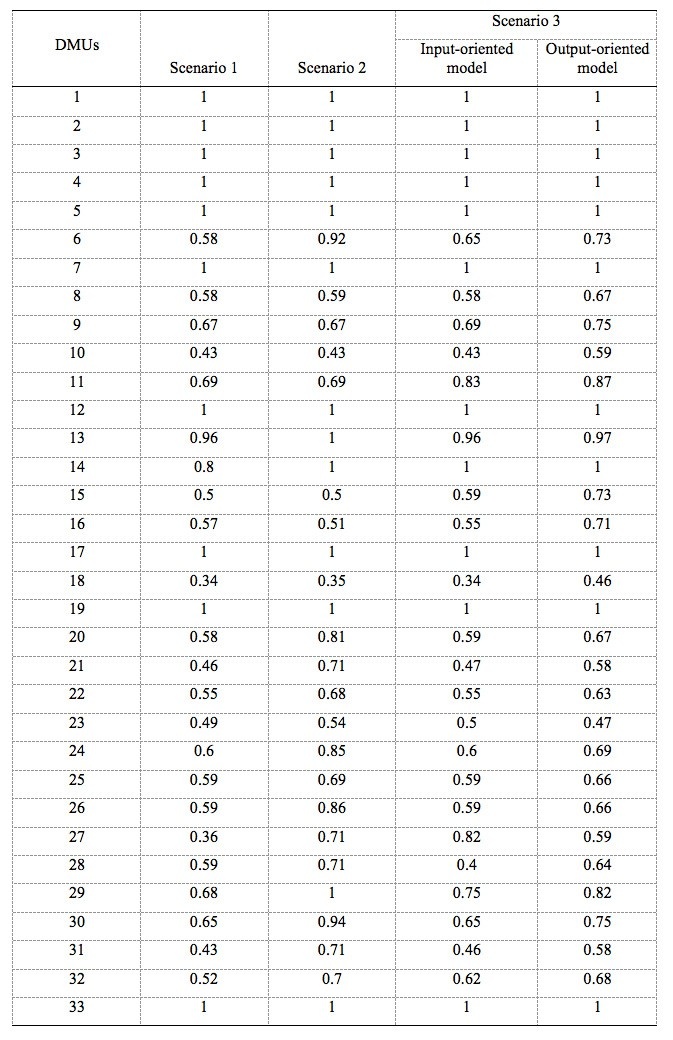
Table 4: Efficiency scores of forest management units (DMUs) based on CCR model in three scenarios. / Tabelle 4: Effizienz der forstlichen Bewirtschaftungseinheiten (DMUs) berechnet mit dem CCR-Modell und drei Szenarien.
Scenario 3 - Apply a monotone decreasing transformation to the undesirable outputs and then to use the adapted variables as outputs
Here a monotone decreasing transformation was performed to the CO2 emission as an undesirable output. Then the adapted variables (CO2 emission) was used as an output in the input-oriented CCR model (Eq. 3) and output-oriented CCR model (Eq. 4). Results showed that in both input–oriented and output-oriented models, 11 DMUs are efficient (Table 4).
The results of scenario 3 is rather similar to the results of the scenario 1 in term of efficient DMUs, the only difference is that DMU 14 is efficient in scenario 3 whereas it is inefficient in the scenario 1. However, there are some differences in the score of inefficient DMUs in both scenarios 1 and 3.
Regarding to the results of DMUs efficiencies (Table 4), the inefficient DMUs (i.e. DMUs 6, 8, 9, 10 etc.) should reduce their input in input-oriented CCR model (scenarios 1 and 2) in order to enhance their efficiencies. In output-oriented CCR model, the DMUs should increase their output (scenario 3) in order to enhance their efficiencies. In fact, the deficient forest management units can become efficient if they reduce their inputs or increase their output. It is possible to determine the virtual input and output for each DMUs using shadow price to investigate how much an inefficient DMU should reduce its input or increase its output in order to become efficient, but it was not the aim of this research (see Mohammadi Limaei, 2013).
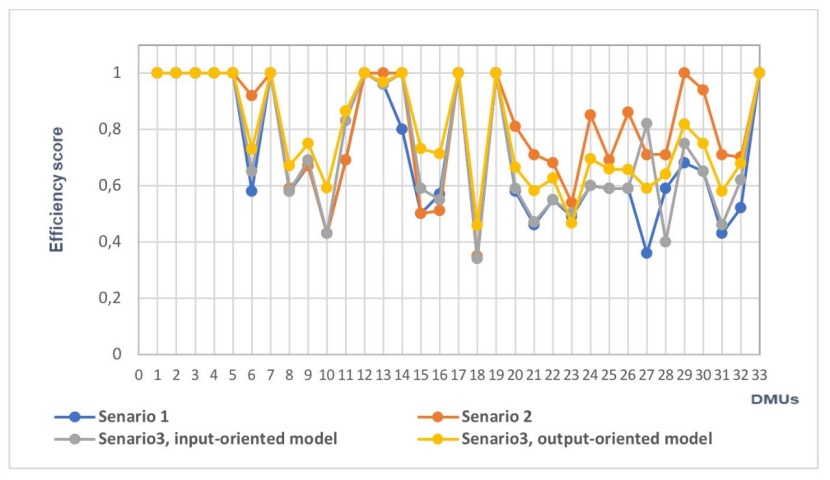
Figure 3: Efficiency distributions of various scenarios based on CCR model. / Abbildung 3: Verteilung der Effizienz nach den drei Szenarien des CCR-Modells.
Optimal relative efficiency and benchmarking
DEA analysis determine the optimal relative efficient DMUs as a base-line or benchmark for inefficient DMUs and provide information on how much inputs can be decreased or outputs increased to increase the efficiency of inefficient DMUs to reach the benchmarks (efficient DMUs). Inefficient DMUs can continuously improve their efficiencies based on efficient DMUs as they are specific targets for improvement over time. According to the results in Table 4, DMUs 1 to 5, 7, 12, 17, 19, 33 are benchmark for other DMUS in scenario 1. More DMUs became benchmark in scenarios 2 and 3.
Efficiency distributions of three scenarios (1, 2 and 3) based on CCR model is shown in Fig. 3. The scores in various scenarios have rather similar trends and they fluctuates between 0.34 and 1.
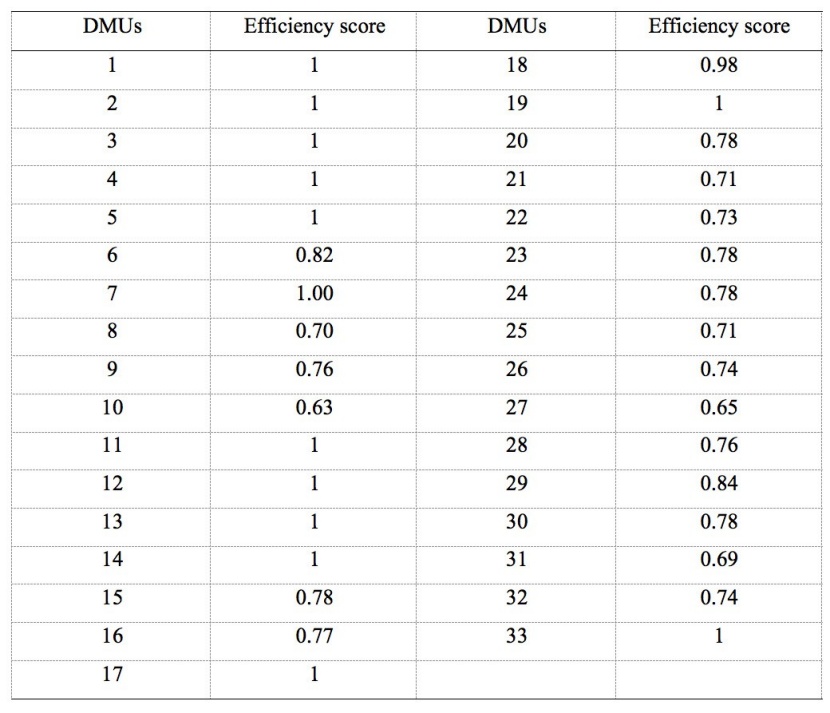
Table 5: Efficiency scores of forest management units from sensitivity analysis using the scenario 3 with output-oriented CCR model. / Tabelle 5: Effizienz der forstlichen Bewirtschaftungseinheiten aus der Sensitivitätsanalyse von Szenario 3 mit dem Output-orientierten CCR-Modell.
Sensitivity analysis of DEA models
Sensitivity analysis is used to investigate the sensitivity of the efficiency scores of the DMUs to the numerical input and output data. The suggested new model examines the robustness of DEA efficiency scores by changing the reference set of DMUs (Agarwal et al., 2014). Due to the similarity of sensitivity analysis in various scenarios, sensitivity analysis (10 % output increased and 10 % input reduced in all DMUs) was done in the scenario 3 with output-oriented CCR model. As results shown in Table 5, the number of efficient DMUs increased and DMU 13 became efficient. In addition, the efficiency score of all DMUs increased.
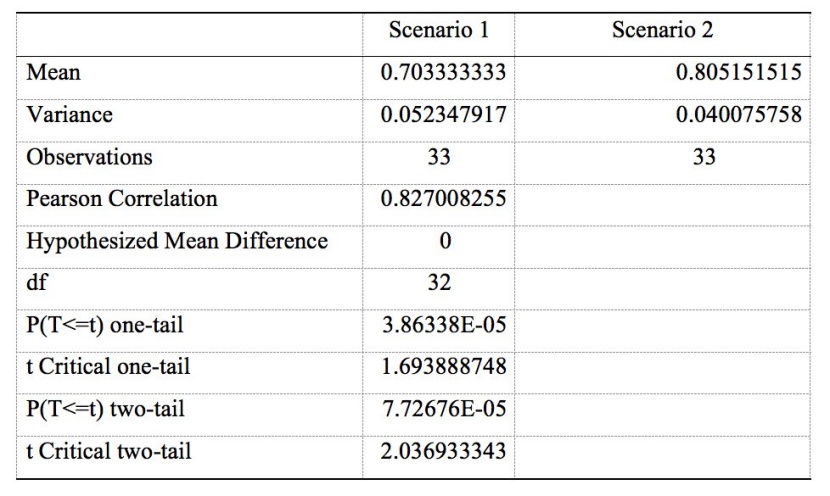
Table 6: Results of paired t-test between scenarios 1 and 2. / Tabelle 6: Ergebnis des paarweisen t-Tests zwischen Szenarien 1 und 2.
Statistical analysis
The results of t-test between scenario 1 (ignoring the CO2 emission) and scenario 2 (considering the undesirable outputs as input) shown in Table 6. Results indicated that there is a significant difference at significance level of 0.05 in the efficiency scores of scenarios 1 and 2 in both one-tailed and two-tailed tests.
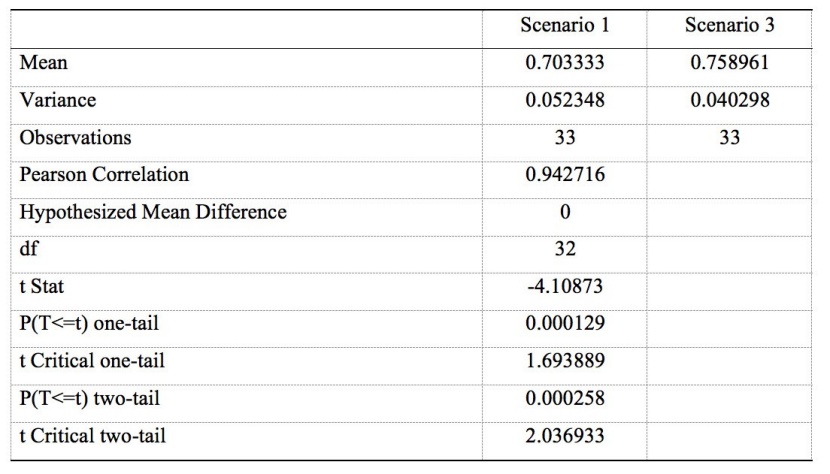
Table 7: Results of paired t-test between scenarios 1 and 3. / Tabelle 7: Ergebnis des paarweisen t-Tests zwischen Szenarien 1 und 3.
The results of t-test to compare the average score of input-oriented and output-oriented CCR models between scenario 1 and scenario 3 ( applying a monotone decreasing transformation to the undesirable outputs and then to use the adapted variables as outputs) shown in Table 7. Results indicated that there is a significant difference at significance level of 0.05 in the efficiency scores of scenarios 1 and 3 in both one-tailed and two-tailed tests.
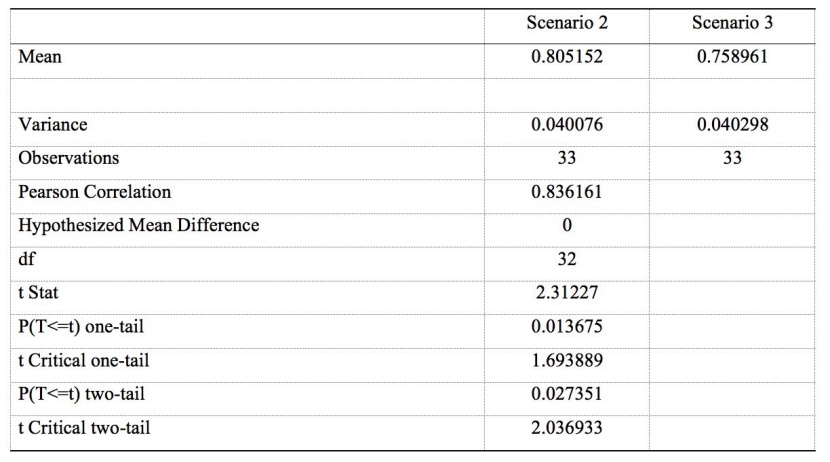
Table 8: Results of paired t-test between scenarios 2 and 3. / Tabelle 8: Ergebnis des paarweisen t-Tests zwischen Szenarien 2 und 3.
Results of t-test indicated that there is a significant difference at significance level of 0.05 in the efficiency scores of scenarios 2 and 3 (average score of input-oriented and output-oriented CCR models) in both one-tailed and two-tailed tests (Table 8).
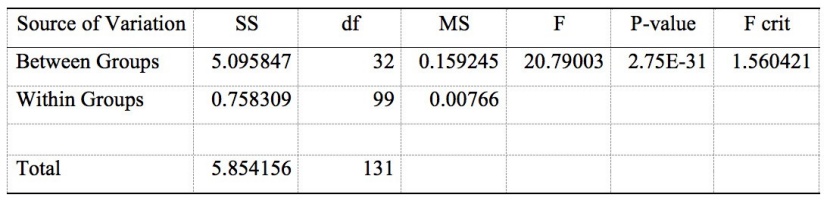
Table 9: Results of ANOVA (single factor) among the various DMUs under three scenarios. / Tabelle 9: Ergebnisse der ANOVA (single factor) zwischen den DMUs und den drei Szenarien.
One way Analysis of Variance (ANOVA) using Excel software was used to investigate, if there is any significance among the means of efficiency scores of various DMUs (33 forest management plans) in three scenarios. Results indicated that there is a significant difference at the significance level of 0.05 in efficiency scores of various DMUs (Table 9).
Discussion
The current research deals with desirable and undesirable factors in forest management units using DEA approach. DEA is used for benchmarking of DMUs and provides information on how much the input of an inefficient DMU can be decreased or its outputs can be increased to make the unit efficient.
It is not appropriate to increase all output for increasing the efficiency score, when there is undesirable output such as CO2 emission during logging operation in forests. Therefore, in this study three scenarios considered to treat with undesirable output such as scenario 1) ignoring the undesirable output, scenario 2) treating the undesirable outputs as inputs, scenario 3) applying a monotone decreasing transformation to the undesirable outputs and then to use the adapted variables as outputs (Seiford and Zhu, 2002). It was shown that the CCR model can be used to improve the efficiency of DMUs through increasing the desirable outputs and decreasing the undesirable outputs. Results of CCR model showed that with ignoring the undesirable output (scenario 1) and considering the undesirable outputs as inputs (scenario 2), 10 and 13 DMUs became efficient, respectively. Furthermore, results of DEA model with considering a monotone decreasing transformation to the CO2 emission and using the adapted variables as outputs (scenario 3) indicated that 11 DMUs became efficient. There is similarity between the results of this study and finding in Seiford and Zhu (2002) that they applied a linear monotone decreasing transformation to treat the undesirable outputs in some paper mills.
The t-test used to determine if the means of efficiency scores are significantly different from each other in three scenarios. Results indicated that there is a significant difference at the efficiency scores of various scenarios in pair at the significance level of 0.05 (Tables 6 to 9). In addition, there are differences in ranking of DMUs performances. Hence the results of this research is in line with finding Färe et al. (1989) that failure to credit mills for pollution reduction can severely distort the ranking of mill performance.
Sensitivity analysis was done in scenario 3 with output-oriented CCR model to investigate how sensitive the efficiency scores of the DMUs are to the numerical input and output data. Results of sensitivity analysis showed that the number of efficient DMUs increased and the efficiency score of all DMUs increased.
Kao and Yang (1991) were the first researchers used DEA for performance measurement of forest industries. Their method applied and developed by several authors as it was reviewed in introduction. In all of the previous studies to evaluate the efficiency of forestry and forest industries, there was less attention to the carbon dynamic such as carbon sequestration and CO2 emission. Ignoring the undesirable (CO2 emission) output may give high efficiency score to some DMUs and will advise the DMUs to increase their efficiency score only by adjusting their economics variables such as cost and revenue. In addition, the amount of sequestered carbon in stem wood volume before and after harvesting as well as the sequestered carbon in harvested timber was considered in this study.
Hence, the results of this study can be a guideline for forest management units to become more efficient considering both economics and carbon dynamics.
Conclusion
Estimating the efficiency of forest management units considering desirable and undesirable output will be an appropriate benchmark for inefficient DMUs to increase their efficiency as well as for governmental organizations to oversight the management units considering economics and environmental objectives which is in line with sustainability issues. This research was a first attempt to consider CO2 emission as an undesirable output in estimating the efficiency of forest management units using DEA approach. In the future studies, more undesirable output could be included in the DEA model such as soil erosion in forest harvesting for increasing the accuracy of the efficiency analysis and giving more weight to the environmental issues. To sum up, the classical approach of efficiency measurement is not an appropriate approach to deal with undesirable output, while the presented approach in scenario 3 (applying a monotone decreasing transformation to the undesirable outputs and then using the adapted variables as outputs) can be considered as a possible appropriate approach in which to make forest management units more sustainable and provide effective guidance on how to tackle undesirable output in forest production systems.
Acknowledgement
The author is grateful to University of Guilan for financial support when he was a visiting researcher in Mid Sweden University.
References
Agarwal, S., Yadav, S.P., Singh, S.P. 2014. Sensitivity analysis in data envelopment analysis, International Journal of Operational Research, 19(2): 174-185.
Bogetoft, P., Thorsen, B.J., Strange, N. 2003. Efficiency and Merger Gains in the Danish Forestry Extension Service. Forest Science, 49:585-595.
Cardillo, D. L. Fortuna, T. 2000. A DEA model for the efficiency evaluation of nondominated paths on a road network, Journal of Operation Research, 121 (2000): 549-558.
Central Bank of Iran, 2019. CPI and Inflation, https://www.cbi.ir/Inflation/Inflation_en.aspx (access date, 20 May, 2018).
Charnes, A, Cooper, W., Rhodes, W. 1978. Measuring the efficiency of decision- making units. European Journal of Operational Research, 2: 429–444.
Charnes, A & Cooper, W. 1984. The non-Archimedean CCR ratio for efficiency analysis: A rejoinder to Boyd and Färe. European Journal of Operational Research, 15: 333-334.
Cooper, W.W., Seiford, L.M. Zhu, J. (Eds.). 2011. Handbook on Data Envelopment Analysis, Springer Science+Business Media, LLC.
Dias, A.C, Arroja, L., Capela, C. 2007. Carbon dioxide emissions from forest operations in Portuguese eucalypt and maritime pine stands, Scandinavian Journal of Forest Research, 22(5): 422-432.
Guilan Department of Natural Resources, 2018. Booklets of Forest Management Plans, Shafaroud Forests, Iran.
FAO. 1999. FRA 2000, Global Forest Cover map. Rome, Italy: FAO, Forestry Department, Working paper, No 50. p. 29.
Färe, R., Grosskopf, S., Lovell, C.A.K., Pasurka, C. 1989. Multilateral productivity comparisons when some outputs are undesirable: a nonparametric approach. The Review of Economics and Statistics, 71: 90–98.
Hailu, A., Veeman, T.S. 2003. Comparative Analysis of Efficiency and Productivity Growth in Canadian Regional Boreal Logging Industries, Canadian Journal of Forest Research, 33:1653-1660.
Helvoigt, T. L., Darius M.A. 2008. Data envelopment analysis of technical efficiency and productivity growth in the US Pacific Northwest sawmill industry, Canadian Journal of Forest Research, 2008, 38(10): 2553-2565
Kao, C., Yang, Y. 1991. Measuring the efficiency of forest management, Forest Science, 37: 1239-1252.
Lu, D. 2006. The potential and challenge of remote sensing based biomass estimation, International Journal of Remote Sensing, 27(7): 1297–1328.
Mohammadi, Z., Mohammadi Limaei, S. Lohmander, P., Olsson, L. 2017. Estimating the aboveground carbon sequestration and its economic value (case study: Iranian Caspian forests), Journal of forest Science, 63 (11): 511–518.
Mohammadi, Z., Mohammadi Limaei, S., Lohmander, P., Olsson, L. 2018. Estimation of a basal area growth model for individual trees in uneven-aged Caspian mixed species forests, Journal of Forestry Research, 29( 5): 1205-1214.
Mohammadi Limaei S. 2010. Mixed strategy game theory, application in forest industry, Forest Policy and Economics, 12(7): 527-531.
Mohammadi Limaei, S. 2013. Efficiency of Iranian Forest Industry Based on DEA Models, Journal of Forestry Research, 24:759-765.
Mohammadi Limaei, S., Seddigh Kouhi, M. & Rostami Sharaji, T. 2014. Goal programming approach for sustainable forest management: (case study in Iranian Caspian forests), Journal of Forestry Research, 25 (2): 429-435.
Parsa Pajouh, D. 1995. Wood Technology, Tehran: University of Tehran Press.
Salehirad, N., Sowlati, T. 2007. Dynamic Efficiency Analysis of Primary Wood Producers in British Columbia. Mathematical and Computer Modelling, 45:1179–1188.
Sagheb-Talebi, Kh., Sajedi, T., Pourhashemi, M., 2013. Forest of Iran, A Treasure from the Past, a Hope for the Future, Springer verlage, 145p.
Seiford, L.M. and Zhu, J. 1998. Sensitivity analysis of DEA models for simultaneous changes in all the data, Journal of the Operational Research Society, 49(10):1060-1071.
Seiford, L.M. and Zhu, J. 2002. Modeling undesirable factors in efficiency evaluation, European Journal of Operational Research, 142:16–20.
Snowdon, P., Raison, J., Keith, H. 2002. Protocol for sampling tree and stand biomass. National carbon accounting system technical report No. 31, Australian Greenhouse Office.
Sporcic, M., Martinic, I., Landekic, M., Lovric, M. 2009, Measuring efficiency of organizational units in forestry by Nonparametric model. Croatian Journal of Forest Engineering, 30: 1-13.
Wu, J., Zhou, Z. 2014. Environmental efficiency of Chinese paper mills along Huai river: Data Envelopment Analysis (DEA) based study, Environmental Engineering and Management Journal, 13(5): 1101-1109.
Zadmirzaei, M., Mohammadi Limaei, S., Amirteimoori, A. 2015. Efficiency analysis of paper mill using data envelopment analysis models (Case study: Mazandaran Wood and Paper Company in Iran). Journal of Agricultural Science and Technology, 17:1381-1391.
Zadmirzaei, M., Mohammadi Limaei, S., Olsson, L. and Amirteimoori, A. 2016. Measuring the performance and returns to scale of forest management plans using data envelopment analysis approach (Case study; Iranian Caspian forests), Caspian Journal of Environmental Sciences, 4(2):155-164.
Zadmirzaei, M., Mohammadi Limaei, S., Olsson, L. and Amirteimoori, A. 2017. Assessing the impact of the external non-discretionary factor on the performance of forest management units using DEA approach, Journal of Forest Research, 22 (3): 144-152.
Zadmirzaei, M. Mohammadi Limaei. S., Amirteimoori, A. 2019. Measuring the relative performance of forest management units: a chance-constrained DEA model in the presence of the nondiscretionary factor, Canadian Journal of Forest Research, 49(7): 788-801.


